Home / Past papers / MLT Quiz 1 / this paper
2024 Oct27: - 27 Oct 2024
Elapsed 00:00
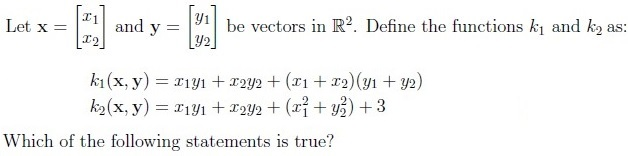




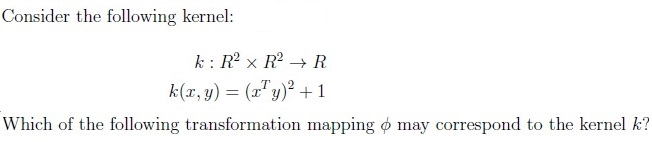





- yes
- No

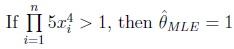
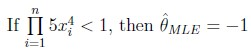


Consider a dataset with 100 total data points. Each data point is classified as either type A or type B. We model this using a Bernoulli distribution, where p is the probability of a data point being type A. If the maximum likelihood estimate (MLE) of p based on the dataset is 0.4, how many data points of type B are there in this dataset?
Comprehension passage - the questions below it refer to this
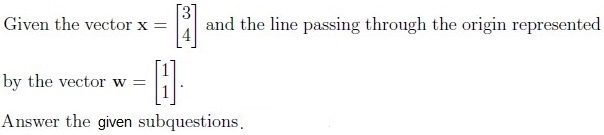
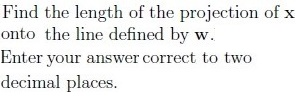
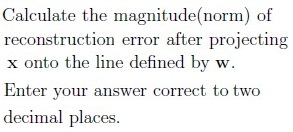
Comprehension passage - the questions below it refer to this
Based on the above data, answer the given subquestions.


- (0,1)
- (2,3)
- (3,2)
- (2,4)
Which point has the lowest probability of being chosen as the 3rd cluster mean? Use squared distance to calculate the scores.
- (1,0)
- (2,3)
- (3,2)
- (1,2)
Answer key
Concepts this paper tests
Auto-generated summary from the source site. Handy as a checklist; the lessons above explain each idea from scratch.
Summary of Core Topics, Concepts, Principles, and Equations
1. Kernels and Kernel Functions
- Concepts: Valid kernels, kernel transformations, kernel PCA.
Equations:
- Kernel functions .
- Example kernels:
- Kernel PCA and dimensionality reduction.
2. Principal Component Analysis (PCA)
- Concepts: Eigenvalues, eigenvectors, variance, dimensionality reduction.
Equations:
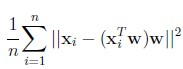
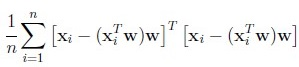
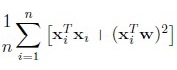
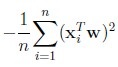
- Reconstruction error:
- Variance captured by principal components:
3. Maximum Likelihood Estimation (MLE)
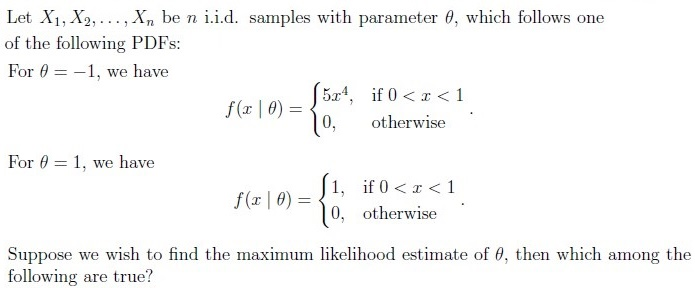
- Concepts: Likelihood functions, probability density functions (PDFs), MLE for parameters.
Equations:
- Likelihood function for different PDFs:
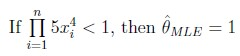
- MLE condition:
4. K-Means Clustering
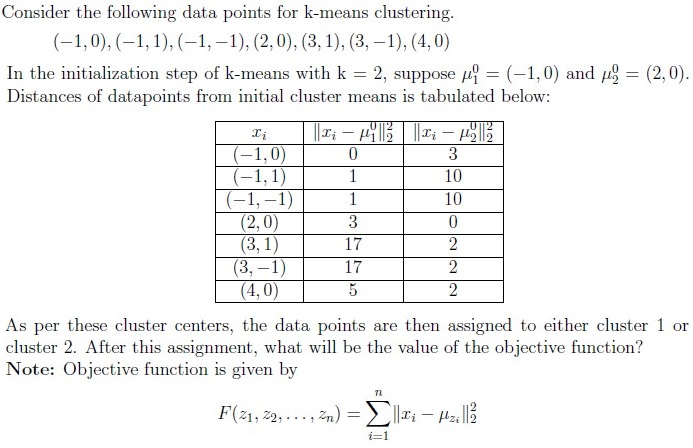
- Concepts: Initialization, cluster assignment, objective function.
Equations:
- Objective function:
- Distance calculations and cluster mean updates.
5. Gaussian Mixture Models (GMM)
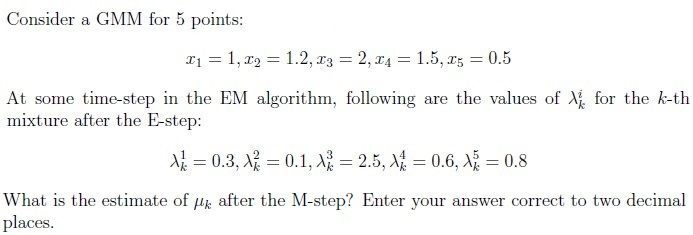
- Concepts: EM algorithm, mixture components, mean estimation.
Equations:
- Mean estimation in M-step:
6. Bernoulli Distribution
- Concepts: Probability, maximum likelihood estimation.
Equations:
- MLE for probability :
7. Projections and Reconstruction Error
- Concepts: Projection onto a line, reconstruction error.
Equations:
- Projection length:
- Reconstruction error: