Home / Past papers / MLT End Term / this paper
IIT M FOUNDATION DIPLOMA FN EXAM - 01 Sep 2024

- 80%
- 60%
- 20%
- 15%


- Bagging → (2), (3); Boosting → (1), (4)
- Bagging → (1), (4); Boosting → (2), (3)
- Bagging → (1), (3); Boosting → (2), (4)
- Bagging → (2), (4); Boosting → (1), (3)
- The predicted labels for x1 and x2 are 1 and −1 respectively.
- The predicted labels for x1 and x2 are −1 and 1 respectively.
- The predicted label for both data-points is 1.
- The predicted label for both data-points is −1.





- 2x1 + x2 = 0
- x1 − 2x2 = 0
- x1 + x2 = 0
- x1 + 2x2 = 0




- 2
- 4
- 3
- 5
- The dataset is linearly separable with a positive margin.
- The perceptron algorithm will terminate after a finite number of iterationswhen trained on this dataset.
- The dataset is linearly separable, but the margin may be zero.
- The dataset is not linearly separable.
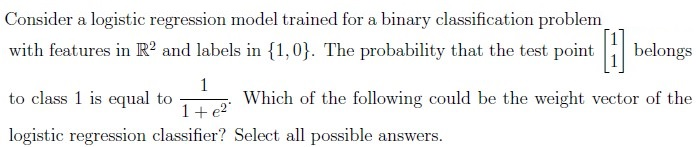



- TRUE
- FALSE
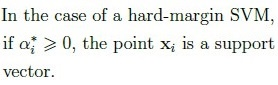
- TRUE
- FALSE
- TRUE
- FALSE






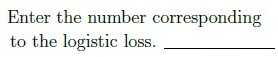



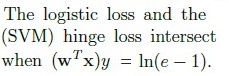

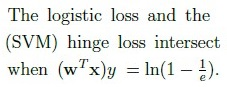
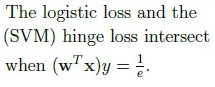
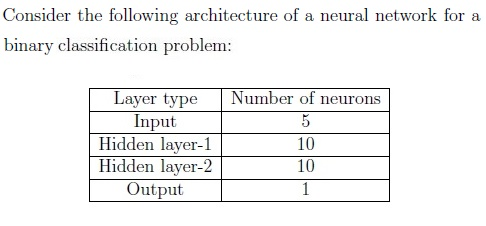
- Sigmoid
- Linear
- ReLU
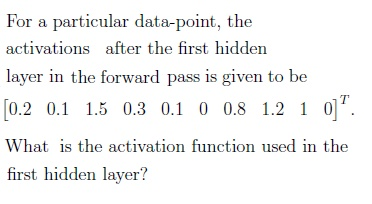
- ReLU
- Sigmoid



Answer key
- Q1 (MCQ, 3 marks): A
- Q2 (MCQ, 3 marks): A
- Q3 (MCQ, 3 marks): A
- Q4 (MCQ, 3 marks): A
- Q5 (MCQ, 3 marks): A
- Q6 (MCQ, 3 marks): A
- Q7 (SA, 3 marks): 0.4
- Q8 (SA, 3 marks): 30
- Q9 (SA, 3 marks): 0.26 to 0.37
- Q10 (MSQ, 3 marks): A, B
- Q11 (MSQ, 3 marks): A, B
- Q12 (MSQ, 3 marks): A, B
- Q13 (MCQ, 1 marks): A
- Q14 (MCQ, 1 marks): B
- Q15 (MCQ, 1 marks): B
- Q16 (SA, 0.5 marks): 2
- Q17 (SA, 0.5 marks): 1
- Q18 (SA, 0.5 marks): 0
- Q19 (SA, 0.5 marks): 3
- Q20 (SA, 0.5 marks): 0
- Q21 (SA, 0.5 marks): -1
- Q22 (SA, 0.5 marks): 3
- Q23 (SA, 0.5 marks): 2
- Q24 (SA, 0.5 marks): 4
- Q25 (SA, 0.5 marks): 1
- Q26 (MCQ, 1 marks): A
- Q27 (SA, 1 marks): 160
- Q28 (MCQ, 1 marks): A
- Q29 (MCQ, 1 marks): A
- Q30 (MCQ, 2 marks): A
Concepts this paper tests
Auto-generated summary from the source site. Handy as a checklist; the lessons above explain each idea from scratch.
Here’s a structured summary of core topics, concepts, principles, and equations essential for the exam, followed by Mermaid knowledge graphs to visualize relationships.
Core Topics & Concepts
1. Principal Component Analysis (PCA)
- Key Idea: Dimensionality reduction by projecting data onto directions (principal components) that maximize variance.
Eigenvalues of Covariance Matrix:
- Represent variance along principal components.
- Total variance = sum of eigenvalues.
- Variance captured by top k PCs = (sum of top k eigenvalues) / (total variance).
- Equation:
(For Q2: → 80%)
2. Regularization & Ridge Regression
- Key Idea: Penalize large weights to prevent overfitting.
- Loss Function:
where .
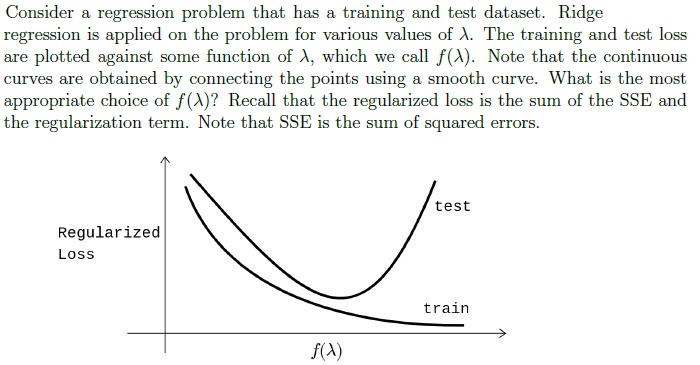
Plot Interpretation (Q3):
- X-axis: (common choice to visualize a wide range of values).
- Y-axis: Regularized loss (SSE + penalty).
- Curves: Training vs. test loss (U-shaped, with test loss minimizing at optimal ).
3. Ensemble Methods (Bagging vs. Boosting)
| Technique | Base Learners | Execution | Key Idea |
|---|---|---|---|
| Bagging | Deep decision trees | Parallel | Reduce variance via bootstrapping. |
| Boosting | Decision stumps | Sequential | Reduce bias via weighted corrections. |
(For Q4: Bagging → (2), (3); Boosting → (1), (4))
4. Support Vector Machines (SVM)
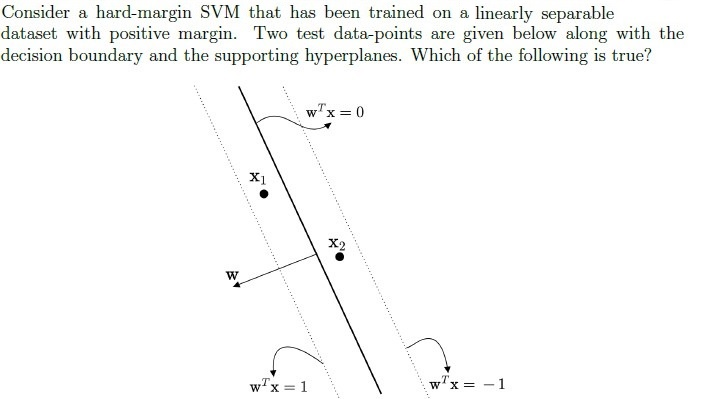
Hard-Margin SVM
- Decision Boundary: .
- Supporting Hyperplanes: .
- Margin: .
- Prediction: . (For Q5: Points beyond → class ; beyond → class .)
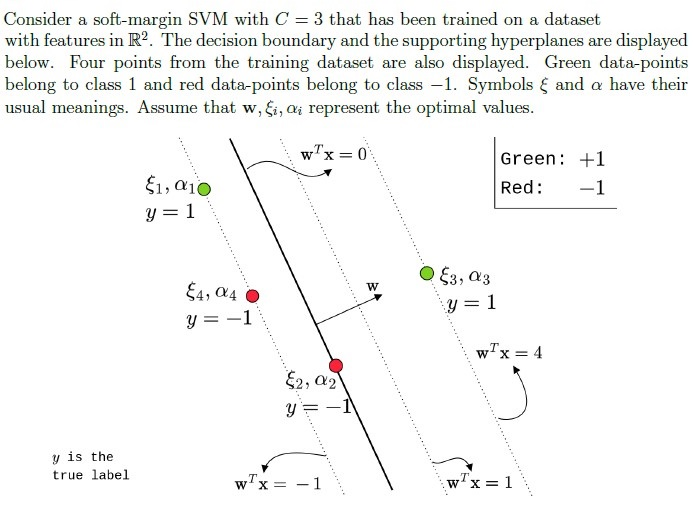
Soft-Margin SVM
- Slack Variables (): Allow margin violations.
- Objective:
subject to .
KKT Conditions:
- .
- If , the point is a support vector (on margin or violated).
(For Q15–Q22: Analyze and based on hyperplane positions.)
Kernel Trick
- Polynomial Kernel:
- Non-negative outputs: Only possible for even (e.g., ). (For Q11: A, B)
5. Naive Bayes
- Class Conditional Independence:
(For Q6: Option A is correct.)
6. Clustering (k-Means)
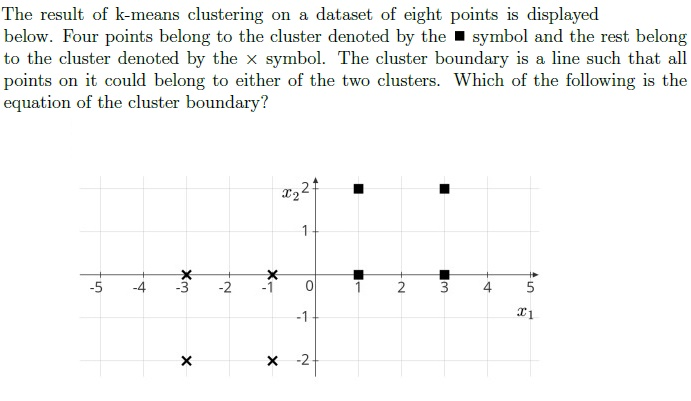
- Cluster Boundary: Perpendicular bisector between centroids. (For Q7: Equation separates ■ and × clusters.)
7. Decision Trees & Information Gain
- Entropy:
- Information Gain:
(For Q10: 0.311 bits.)
8. Maximum Likelihood Estimation (MLE)
- Bernoulli MLE:
(For Q9: , successes = 10 → total trials = 40 → zeros = 30.)
9. Loss Functions in Classification
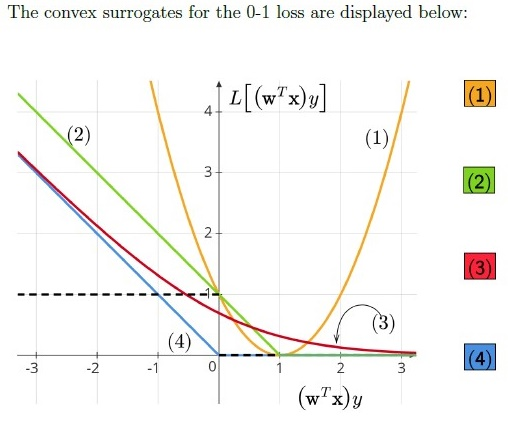
| Loss | Equation | Curve Color (Q23–Q26) |
|---|---|---|
| Logistic | Red (3) | |
| Hinge (SVM) | Green (2) | |
| Perceptron | Blue (4) | |
| Squared | Yellow (1) |
(For Q23–Q26: Match curves to losses.)
10. Neural Networks
Architecture
Parameters: Weights between layers (ignore biases).
- Input → Hidden-1: .
- Hidden-1 → Hidden-2: .
- Hidden-2 → Output: .
- Total: .
(For Q28: 160.)
Activation Functions
Output Layer (Binary Classification):
- Sigmoid (for cross-entropy loss).
(For Q29: A.)
Hidden Layer:
- ReLU: (sparse activations, e.g., zeros in Q30).
2. SVM Concepts
3. Ensemble Methods
4. Loss Functions
5. Neural Network Parameters
Key Equations Summary
| Topic | Equation |
|---|---|
| PCA Variance | |
| Ridge Regression | |
| SVM Margin | |
| Naive Bayes | |
| Entropy | |
| Information Gain | |
| Bernoulli MLE | |
| Logistic Loss | |
| Hinge Loss | |
| Neural Net Parameters | (ignoring biases) |