Home / Past papers / MLT Quiz 1 / this paper
IIT M IMPROVEMENT AN EXAM QID2 26 Oct - 26 Oct 2025
- It always converges.
- It may fail to converge for an initialization while it may converge for otherinitialization.
- It is sensitive to outliers.
- The solution produced is always the optimal.

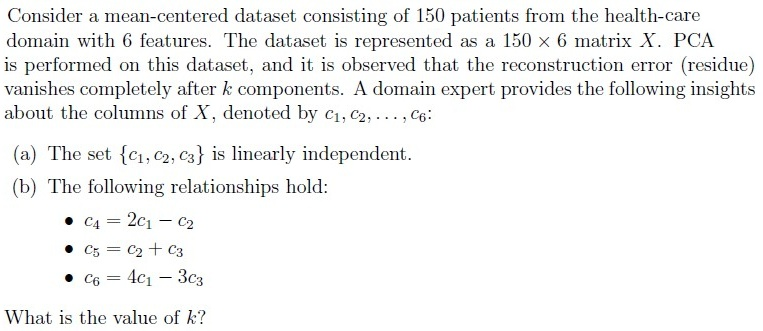
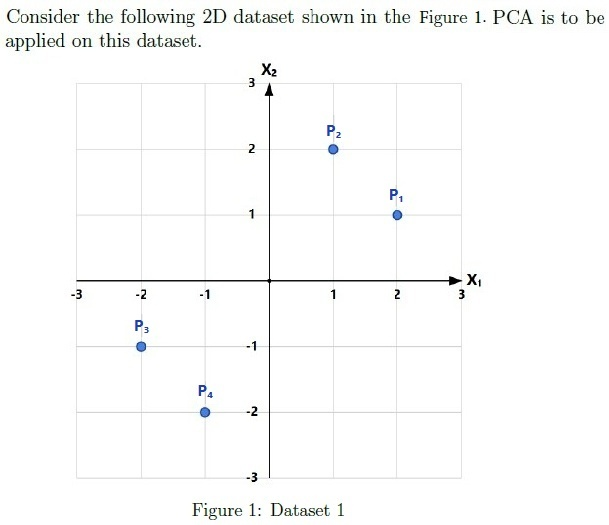
- There will be 50 non-zero eigenvalues of the covariance matrix.
- There will be 6 non-zero eigenvalues of the covariance matrix.
- Using the first 5 principal components, the dataset can be reconstructed withzero residue.
- The variance captured by the top 6 principal components equals the totalvariance of the dataset.
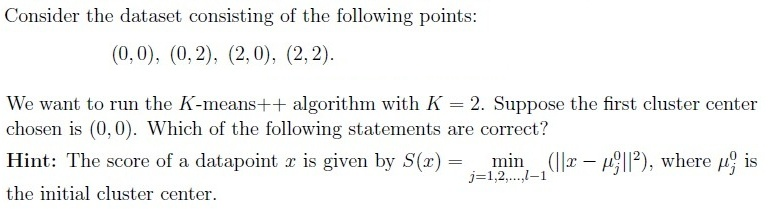
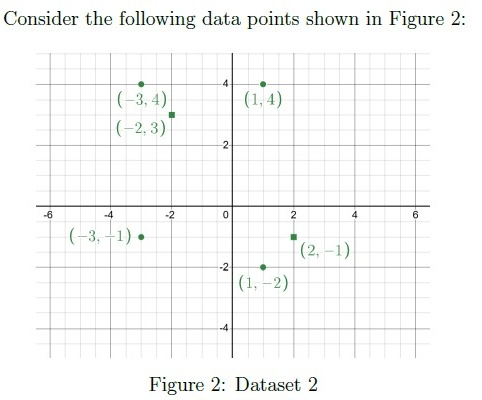
- The points (0, 2), (2, 0), and (2, 2) have the equal probability of being chosen asthe second cluster center.
- The probability of selecting (2, 2) as the second cluster center is twice that ofselecting (0, 2).
- If (2, 2) is chosen as the second cluster center, the algorithm will alwaysconverge in one iteration.
- The tie-breaking rule will affect the final cluster centers.
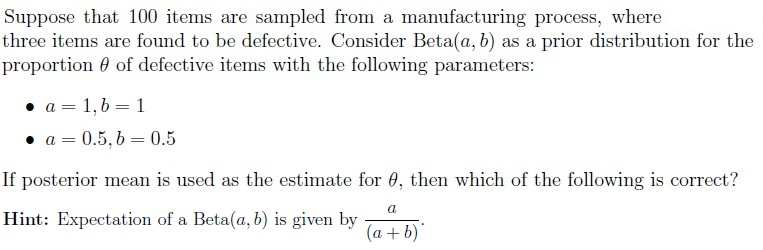
- Posterior mean for Beta(1, 1) is 0.039.
- Posterior mean for Beta(1, 1) is 0.03.
- Posterior mean for Beta(0.5, 0.5) is 0.025.
- Posterior mean for Beta(0.5, 0.5) is 0.034.















Answer key
- Q1 (MSQ, 2 marks): A, C
- Q2 (MSQ, 4 marks): B, D
- Q3 (MSQ, 4 marks): B, C, D
- Q4 (MSQ, 4 marks): A, D
- Q5 (MSQ, 3 marks): A, B, D
- Q6 (SA, 3 marks): 3
- Q7 (SA, 3 marks): 0.45 to 0.50
- Q8 (MCQ, 2 marks): B
- Q9 (SA, 2 marks): 4.5
- Q10 (SA, 2 marks): 0.5
- Q11 (MCQ, 3 marks): B
- Q12 (SA, 3 marks): 0.64 to 0.68
- Q13 (MCQ, 3 marks): A
- Q14 (SA, 2 marks): 1
Concepts this paper tests
Auto-generated summary from the source site. Handy as a checklist; the lessons above explain each idea from scratch.
Here’s a structured summary of core topics, concepts, principles, and equations for the Diploma-Level Machine Learning Techniques Exam, along with Mermaid knowledge graphs to visualize relationships.
1. Core Topics & Key Concepts
A. Clustering Algorithms
1. K-Means & K-Means++
Lloyd’s Algorithm (K-Means):
- Convergence: Always converges (monotonically decreases objective function, but may reach local minima).
- Sensitivity: Sensitive to outliers and initialization.
- Optimality: Does not guarantee global optimum (depends on initialization).
- Objective Function:
K-Means++ Initialization:
- First center chosen uniformly at random.
- Subsequent centers chosen with probability proportional to (squared distance to nearest center).
- Score for datapoint :
2. EM Algorithm for Gaussian Mixture Models (GMM)
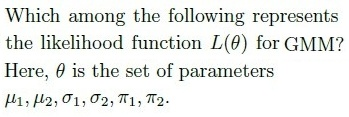
- Likelihood Function for GMM:
where:
- : Mixing coefficient (prior probability of cluster ).
: Gaussian PDF.
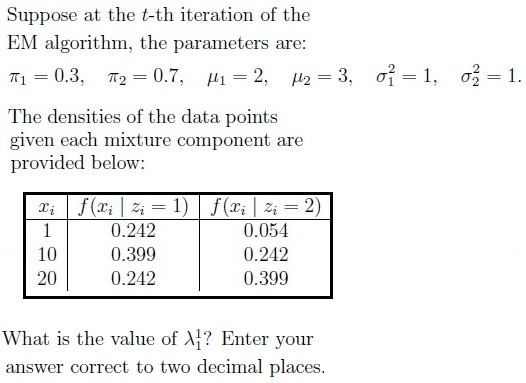
- E-Step: Compute responsibilities ():
- M-Step: Update parameters:
B. Dimensionality Reduction (PCA)
1. Principal Component Analysis (PCA)
- Goal: Find orthogonal axes (principal components) that maximize variance.
Steps:
- Center the data (subtract mean).
- Compute covariance matrix .
Eigendecomposition: , where:
- : Matrix of eigenvectors (principal components).
- : Diagonal matrix of eigenvalues (variances).
- Project data onto top- eigenvectors.
- Variance Explained:
Reconstruction Error (Residue):
- If data lies in a -dimensional subspace, the first PCs capture all variance.
- Eigenvalues = 0 for dimensions beyond intrinsic dimensionality.
2. Key Properties
Covariance Matrix Rank:
- If data lies in a -dimensional subspace, covariance matrix has non-zero eigenvalues.
Example:
If all points lie in a 6D subspace in , PCA yields:
- 6 non-zero eigenvalues.
- First 6 PCs capture 100% variance.
C. Bayesian Statistics
1. Beta-Binomial Model for Proportions
- Prior:
- Likelihood:
- Posterior:
- Posterior Mean (Estimate for ):
Example:
- Prior: (uniform) or .
- Data: 3 defects in 100 samples.
Posterior Mean:
- For :
- For :
D. Kernel Methods
1. Valid Kernel Functions
A function is a valid kernel if it satisfies Mercer’s condition (positive semi-definite Gram matrix).
Examples:
- Gaussian (RBF) Kernel:
- Polynomial Kernel:
- Laplacian Kernel:
Invalid Kernel:
- (not PSD).
2. Key Equations Summary
| Topic | Equation |
|---|---|
| K-Means Objective | |
| K-Means++ Score | |
| PCA Variance | |
| PCA Proportion | |
| GMM Likelihood | |
| Beta Posterior Mean | |
| Gaussian Kernel |
Graph 2: Dimensionality Reduction (PCA)
Graph 3: Bayesian Statistics & Kernels
4. Exam Tips
PCA:
- If data lies in a -dimensional subspace, first PCs capture all variance.
- Eigenvalues = 0 for redundant dimensions.
K-Means:
- Converges always but may not find the global optimum.
- K-Means++ improves initialization by weighting distances.
GMM:
- Likelihood involves sum over components (mixture model).
- EM alternates between E-step (expectation) and M-step (maximization).
Bayesian Estimation:
- Posterior mean is the estimate for .
- Beta prior is conjugate for Binomial likelihood.
Kernels:
- RBF, Polynomial, Laplacian are valid.
- Absolute difference is not a valid kernel.