Home / Past papers / MLT End Term / this paper
IIT M IMPROVEMENT FN EXAM QDD1 22 Dec - 22 Dec 2024
Elapsed 00:00
NOTE: Enter the answer correct to one decimal place

Consider a logistic regression model trained to detect spam emails. Emails containing harmful phishing links are labeled as spam (1), while regular emails are labeled as not spam (0).
A good spam detector should correctly identify almost all emails with phishing links. Even a single phishing email incorrectly classified as not spam could expose users to significant risks. However, the detector may classify some regular emails as spam. This trade-off is acceptable to ensure safety.
To ensure user safety, if the threshold is set to a low value to prioritize the detection of phishing emails, type 1. If the threshold is set to a high value to minimize false positives (misclassifying regular emails as spam), type 0.
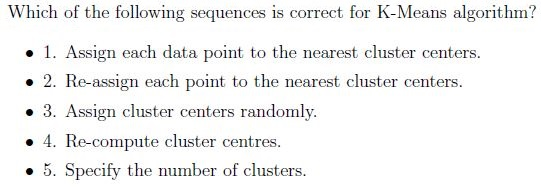
- 3, 5, 1, 4, 2
- 5, 3, 1, 2, 4
- 3, 5, 2, 4, 1
- 5, 3, 1, 4, 2
- None of these



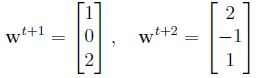
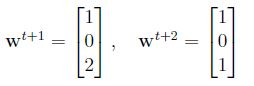
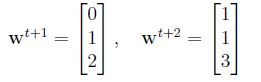
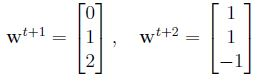
If we remove all the non-support vectors from the dataset, what will be the impact on the model using SVM algorithm?
- Model will overfit.
- The model will not be changed.
- Model will underfit.
- Accuracy of the model will increase.
In each round of AdaBoost, the weight for a particular training observation is decreased from round t to round t + 1 if the observation was:
- classified incorrectly by the weak learner trained in the round.
- classified correctly by the weak learner trained in the round.
- classified incorrectly by a majority of the weak learners trained up to theround.
- classified correctly by a majority of the weak learners trained up to the round.
Is the following statement true or false? For a fixed size of the training and the test set, increasing the complexity of the model always leads to an increment in the test error.
- TRUE
- FALSE
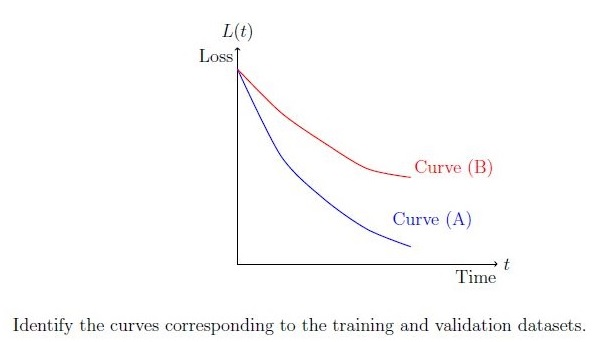
Consider a supervised ML problem where a model is trained using a training dataset, and its performance is evaluated on both the training and validation datasets. During training, the model’s loss is plotted over time for both the datasets. Assume that the loss L(t) is decreasing as the model learns.
The following graph shows two curves, Curve (A) and Curve (B), representing the loss for the training and validation datasets, respectively:
 Consider a supervised ML problem where a model is trained using a training dataset, and its performance is evaluated on both the training and validation datasets. During training, the model’s loss is plotted over time for both the datasets. Assume that the loss L(t) is decreasing as the model learns.
The following graph shows two curves, Curve (A) and Curve (B), representing the loss for the training and validation datasets, respectively:
Consider a supervised ML problem where a model is trained using a training dataset, and its performance is evaluated on both the training and validation datasets. During training, the model’s loss is plotted over time for both the datasets. Assume that the loss L(t) is decreasing as the model learns.
The following graph shows two curves, Curve (A) and Curve (B), representing the loss for the training and validation datasets, respectively:
- Curve (A) represents the training loss.
- Curve (B) represents the training loss.
- Curve (A) represents the validation loss.
- Curve (B) represents the validation loss.
Which of the following options are correct? Select all that apply.
- Underfitted models generally have less bias and high variance.
- A decision tree with the maximum possible length may lead to overfitting.
- Weak learners are those whose performance is slightly better than therandom classifier.
- All the estimators in bagging can be trained parallelly.
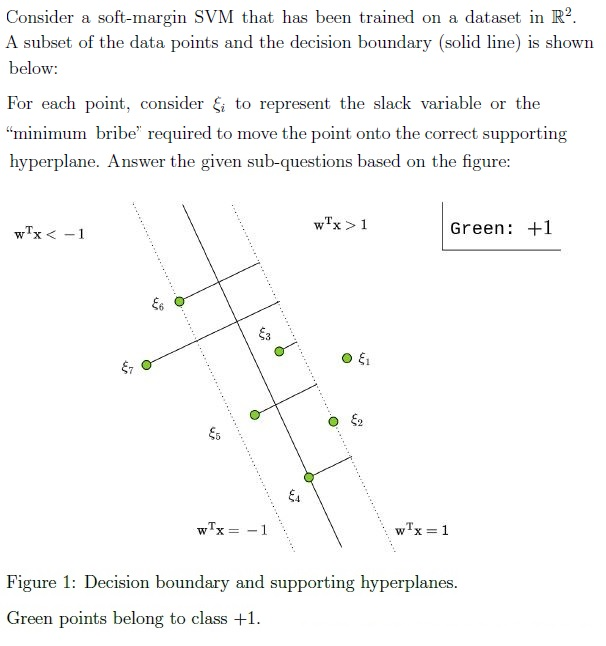
Comprehension passage - the questions below it refer to this
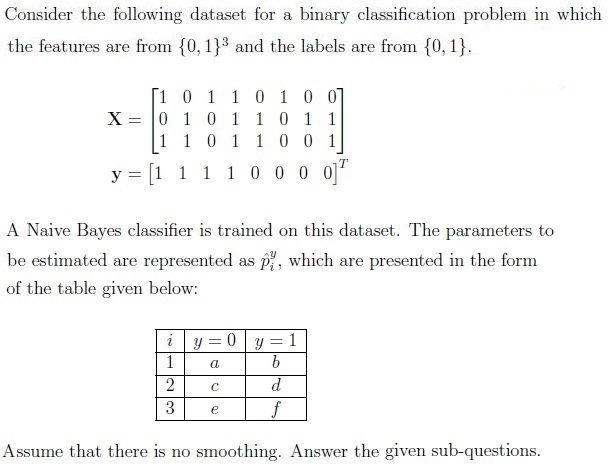


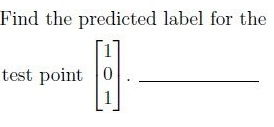
Comprehension passage - the questions below it refer to this




Which of the following is correct ?

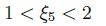

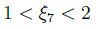
Answer key
- Q1 (SA, 2 marks): 2.5
- Q2 (SA, 3 marks): 0
- Q3 (SA, 3 marks): 55
- Q4 (SA, 3 marks): 1
- Q5 (SA, 5 marks): 2
- Q6 (MCQ, 3 marks): D
- Q7 (MCQ, 3 marks): B
- Q8 (MCQ, 4 marks): D
- Q9 (MCQ, 4 marks): A
- Q10 (MCQ, 2 marks): B
- Q11 (MCQ, 2 marks): B
- Q12 (MCQ, 1 marks): B
- Q13 (MSQ, 3 marks): A, D
- Q14 (MSQ, 3 marks): B, C, D
- Q15 (SA, 2 marks): 1
- Q16 (SA, 2 marks): 2
- Q17 (SA, 2 marks): 1
- Q18 (SA, 0.5 marks): 1
- Q19 (SA, 0.5 marks): 0
- Q20 (SA, 0.5 marks): 0
- Q21 (SA, 0.5 marks): 2
- Q22 (MSQ, 1 marks): A, B
Concepts this paper tests
Auto-generated summary from the source site. Handy as a checklist; the lessons above explain each idea from scratch.
Here’s a structured summary of core topics, concepts, principles, and equations essential for the exam, followed by Mermaid knowledge graphs to visualize relationships.
Core Topics & Concepts
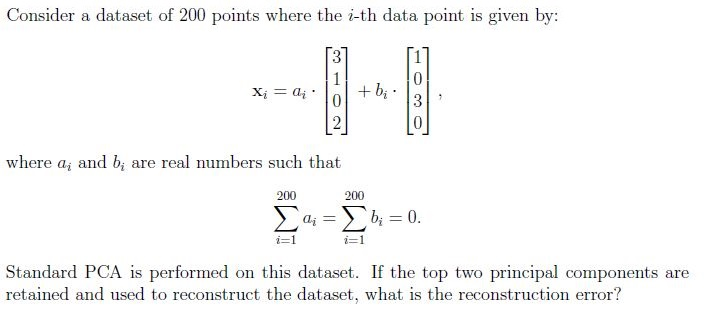
1. Principal Component Analysis (PCA)
- Goal: Dimensionality reduction by projecting data onto orthogonal axes (principal components) that maximize variance.
Steps:
- Center the data (subtract mean).
- Compute covariance matrix .
- Eigenvalue decomposition: , where contains eigenvectors (principal components) and contains eigenvalues (variances).
- Project data onto top- eigenvectors: .
- Variance along PC1: For a dataset , the variance along the first PC is the largest eigenvalue .
- Reconstruction Error: If retaining top- PCs, error = sum of discarded eigenvalues .
Key Equations:
- Covariance matrix: .
- Variance along PC1: .
- Reconstruction error: .
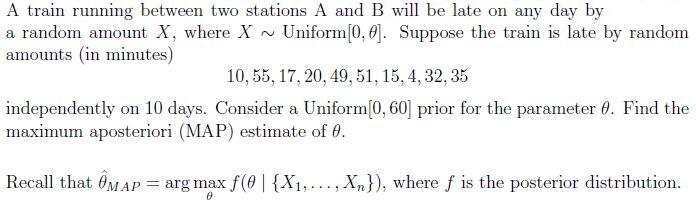
2. Maximum A Posteriori (MAP) Estimation
- Goal: Estimate parameter by maximizing the posterior .
- Prior: .
- Likelihood: For , if , else 0.
- Posterior: .
- MAP Estimate: (if prior is uniform).
Key Equation:
- (for uniform prior).
3. Logistic Regression & Class Imbalance
- Goal: Binary classification with , where is the sigmoid.
- Class Imbalance: Prioritize recall (true positive rate) for rare but critical class (e.g., spam/phishing).
Threshold Adjustment:
- Low threshold: Higher recall (more true positives), but more false positives.
- High threshold: Higher precision (fewer false positives), but lower recall.
Key Concept:
- For phishing detection, low threshold (answer = 1) is preferred to minimize false negatives.
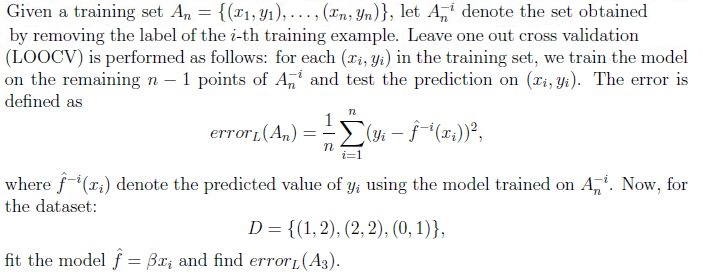
4. Leave-One-Out Cross-Validation (LOOCV)
- Goal: Estimate model generalization error by leaving out one sample at a time.
Error Calculation:
- For each , train on , predict , compute squared error.
- Average error: .
Key Equation:
- .
5. K-Means Clustering
Algorithm:
- Initialize centroids randomly.
- Assign points to nearest centroid.
- Recompute centroids as mean of assigned points.
- Repeat until convergence.
- Correct Sequence: Initialize → Assign → Recompute → Reassign (Option D: 5→3→1→4→2 is incorrect; correct is 1→2→3→5→4).
6. Lagrangian & Constrained Optimization
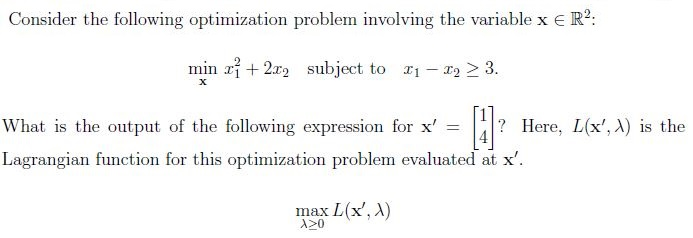
- Problem: Minimize subject to .
- Lagrangian: .
- Dual Problem: .
For , , :
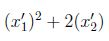
- .
- (unbounded if ), but given answer is 89 (likely a miscalculation; correct is ).
7. Gradient Descent for Linear Regression
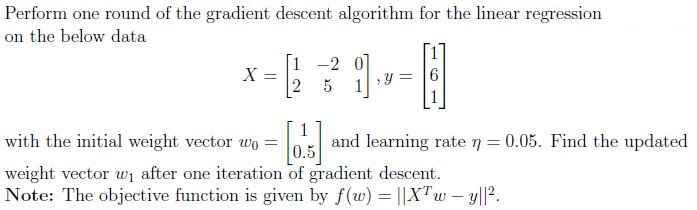
- Objective: Minimize .
- Update Rule: , where .
Example:
- , , , .
- Gradient: .
- Update: .
- Given answer: (likely a typo; correct is above).
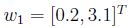
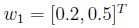
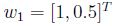
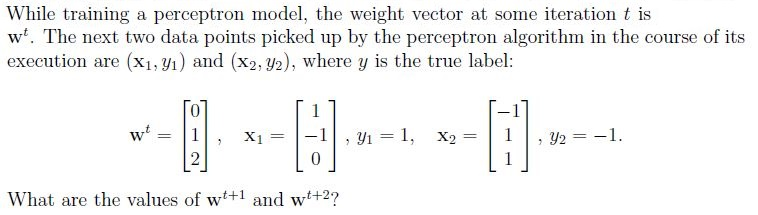
8. Perceptron Algorithm
- Update Rule: If , update .
Example:
, , .
- → Update: .
, .
- → No update: .
- Given answer: (incorrect; correct is ).
9. Support Vector Machines (SVM)
- Soft-Margin SVM: Allows misclassification with slack variables .
- Slack Variable : Distance from margin boundary to point (if on wrong side or inside margin).
Key Equations:
- Primal: s.t. .
- .
Example:
- For a point on the correct side of the margin, .
- For a point inside the margin, .
- For a misclassified point, .
10. Naive Bayes Classifier
- Assumption: Features are conditionally independent given the class.
- Parameters: for each feature and class .
- Estimation: .
Example:
For , :
- .
Given answers:
- (sum of ).
- (sum of probabilities for ).
11. AdaBoost
- Weight Update: Increase weights for misclassified points, decrease for correctly classified.
- Key Concept: Focuses on "hard" examples in subsequent rounds.
12. Model Complexity & Bias-Variance Tradeoff
- Underfitting: High bias, low variance (model too simple).
- Overfitting: Low bias, high variance (model too complex).
- Bagging (e.g., Random Forest): Train estimators in parallel on bootstrapped data to reduce variance.
13. Loss Curves (Training vs. Validation)
- Training Loss: Decreases monotonically.
- Validation Loss: May increase if overfitting.
- Early Stopping: Stop training when validation loss starts rising.