Home / Past papers / MLT Quiz 1 / this paper
IIT M IMPROVEMENT AN EXAM QIB4 26 Oct - 26 Oct 2025
Elapsed 00:00
Which among the following is true with respect to the Lloyds’ algorithm?
- It always converges.
- It may fail to converge for an initialization while it may converge for otherinitialization.
- It is sensitive to outliers.
- The solution produced is always the optimal.

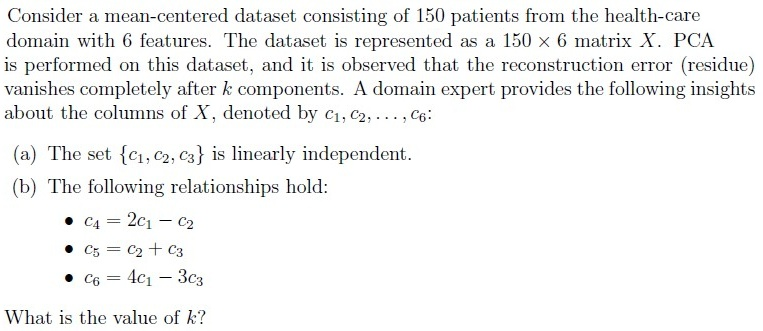
- There will be 50 non-zero eigenvalues of the covariance matrix.
- There will be 6 non-zero eigenvalues of the covariance matrix.
- Using the first 5 principal components, the dataset can be reconstructed withzero residue.
- The variance captured by the top 6 principal components equals the totalvariance of the dataset.
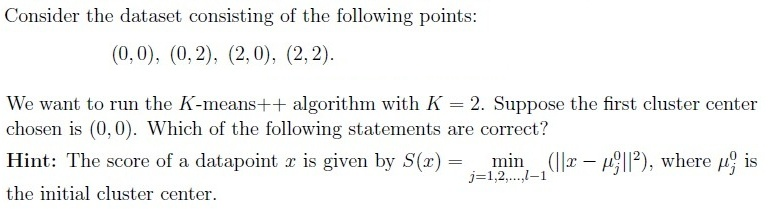
- The points (0, 2), (2, 0), and (2, 2) have the equal probability of being chosen asthe second cluster center.
- The probability of selecting (2, 2) as the second cluster center is twice that ofselecting (0, 2).
- If (2, 2) is chosen as the second cluster center, the algorithm will alwaysconverge in one iteration.
- The tie-breaking rule will affect the final cluster centers.
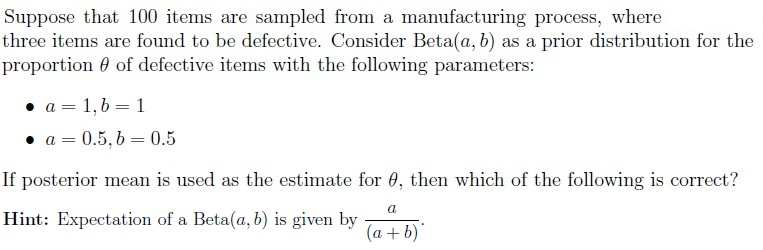
- Posterior mean for Beta(1, 1) is 0.039.
- Posterior mean for Beta(1, 1) is 0.03.
- Posterior mean for Beta(0.5, 0.5) is 0.025.
- Posterior mean for Beta(0.5, 0.5) is 0.034.
Which of the following are valid kernel functions? Select all that apply.




Comprehension passage - the questions below it refer to this
Based on the above data, answer the given subquestions.
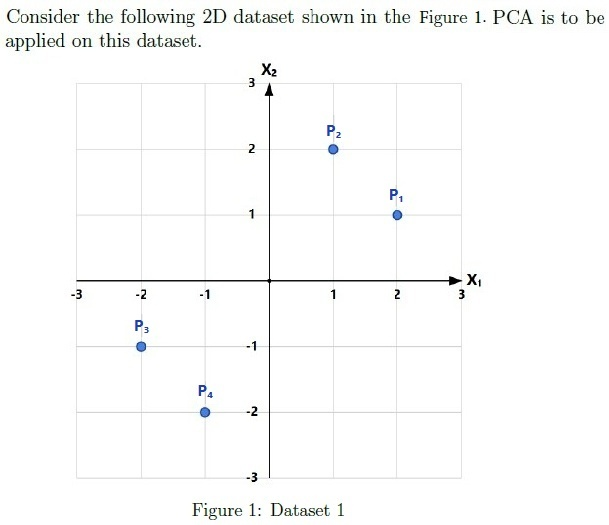
What is the covariance matrix of the dataset?


If standard PCA is performed on this dataset, what is the variance along the first principal component? Enter the answer correct to one decimal place.
If standard PCA is performed on this dataset, what is the variance along the second principal component? Enter the answer correct to one decimal place.
Comprehension passage - the questions below it refer to this
Based on the above data, answer the given subquestions.





Comprehension passage - the questions below it refer to this
Based on the above data, answer the given subquestions.
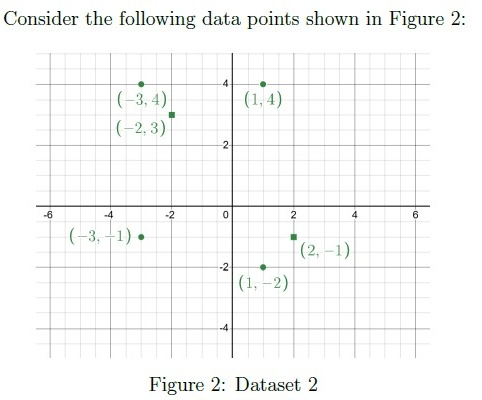
Perform K-means clustering with K = 2 and initial cluster centers at (−2, 3) and (2,−1). What are the final means of clusters after convergence?




Suppose we introduce a new data point (0, 0) to the existing dataset and perform K means with the same initial cluster centers. How many iterations would it require now for convergence?
Answer key
- Q1 (MSQ, 2 marks): A, C
- Q2 (MSQ, 4 marks): B, D
- Q3 (MSQ, 4 marks): B, C, D
- Q4 (MSQ, 4 marks): A, D
- Q5 (MSQ, 3 marks): A, B, D
- Q6 (SA, 3 marks): 3
- Q7 (SA, 3 marks): 0.45 to 0.50
- Q8 (MCQ, 2 marks): B
- Q9 (SA, 2 marks): 4.5
- Q10 (SA, 2 marks): 0.5
- Q11 (MCQ, 3 marks): B
- Q12 (SA, 3 marks): 0.64 to 0.68
- Q13 (MCQ, 3 marks): A
- Q14 (SA, 2 marks): 1
Concepts this paper tests
Auto-generated summary from the source site. Handy as a checklist; the lessons above explain each idea from scratch.
Here’s a structured summary of core topics, concepts, principles, and equations for the Diploma-Level Machine Learning Techniques exam, along with Mermaid knowledge graphs to visualize relationships.
1. Core Topics & Key Concepts
A. Clustering (K-Means, K-Means++, Lloyd’s Algorithm)
Key Concepts:
Lloyd’s Algorithm (Standard K-Means):
- Iterative algorithm to minimize within-cluster sum of squares (WCSS).
- Convergence: Always converges (monotonically decreases WCSS), but may reach local optima.
- Sensitivity to Outliers: Yes (since it uses Euclidean distance).
- Optimality: Does not guarantee global optimum (depends on initialization).
K-Means++ Initialization:
- Goal: Spread initial centroids to improve convergence.
- Selection Probability: Proportional to squared distance from existing centroids:
- Advantage: Reduces likelihood of poor clustering.
Convergence Criteria:
- Stops when centroids stabilize or max iterations reached.
Equations:
- WCSS (Within-Cluster Sum of Squares):
- Centroid Update:
B. Principal Component Analysis (PCA)
Key Concepts:
Dimensionality Reduction:
- Projects data onto orthogonal axes (principal components) that maximize variance.
- Intrinsic Dimensionality: If data lies in a -dimensional subspace of , the first PCs capture all variance.
Eigenvalue Decomposition:
- Covariance matrix (if data is centered).
- Eigenvalues (): Represent variance along principal components.
- Eigenvectors: Principal components (directions of max variance).
Reconstruction Error:
- Zero if . Otherwise, residual error exists.
- Proportion of Variance Explained:
Equations:
- Covariance Matrix:
- PCA Projection:
( = eigenvectors of ).
- Reconstruction:
C. Bayesian Statistics (Beta-Binomial Model)
Key Concepts:
Beta Distribution (Prior for Proportions):
- Conjugate prior for Binomial likelihood.
- PDF:
- Mean:
Posterior Update:
- Given data :
- Posterior Mean:
Equations:
- Posterior Parameters:
D. Kernel Methods
Key Concepts:
Kernel Trick:
- Maps data to higher-dimensional space where linear separation is possible.
- Kernel Function: .
Valid Kernels (Mercer’s Condition):
- Must be symmetric and positive semi-definite.
Examples:
- Gaussian (RBF) Kernel:
- Polynomial Kernel:
- Laplacian Kernel:
- Invalid Kernel: (not PSD).
E. Gaussian Mixture Models (GMM) & EM Algorithm
Key Concepts:
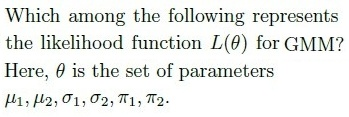
GMM Likelihood:
- Mixture of Gaussians:
- Log-Likelihood:
EM Algorithm:
- E-Step: Compute responsibilities ():
- M-Step: Update parameters:
Graph 2: PCA Concepts
Graph 3: Bayesian & GMM Concepts
Graph 4: Kernel Methods
3. Summary of Key Equations
| Topic | Equation |
|---|---|
| K-Means WCSS | |
| PCA Variance | |
| Beta Posterior Mean | |
| GMM Likelihood | |
| EM Responsibility | |
| Gaussian Kernel |
4. Exam Tips
PCA:
- If data lies in a -dimensional subspace, first PCs capture all variance.
- Reconstruction error is zero if .
K-Means++:
- Second centroid is chosen with probability proportional to .
Bayesian:
- Posterior mean for is after updating with data.
GMM:
- Likelihood involves a product of sums (not sum of products).
Kernels:
- is not a valid kernel. RBF, Polynomial, and Laplacian are valid.