Home / Past papers / MLT End Term / this paper
2023 Dec24: IIT M FN EXAM FDD1 - 24 Dec 2023
Elapsed 00:00



Comprehension passage - the questions below it refer to this
Based on the above data, answer the given subquestions.
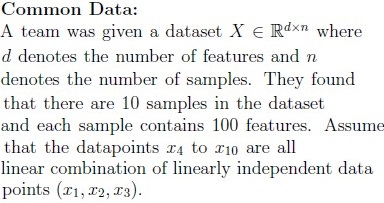
Suppose the team applies linear PCA on the dataset and reconstructs the data points with zero error using k principal components (directions). For which value of k the reconstruction error would become zero?
- 1
- 2
- 3
- 5
- 10
- 100
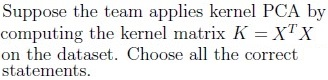
(Enter your answer correctly to two decimal places)






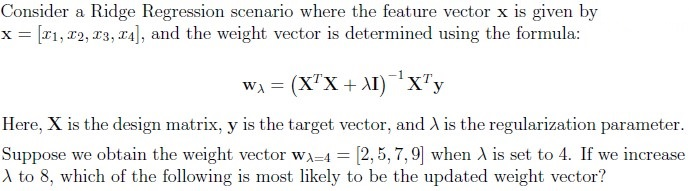
- [2, 6, 9, 12]
- [2, 4, 7, 10]
- [3, 5, 8, 11]
- [1, 3, 6, 8]
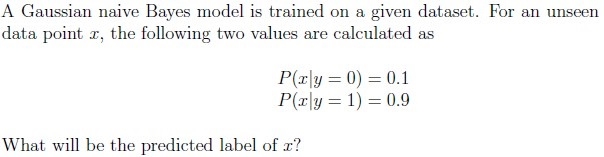
- 0
- 1
- Insufficient information to make a prediction.
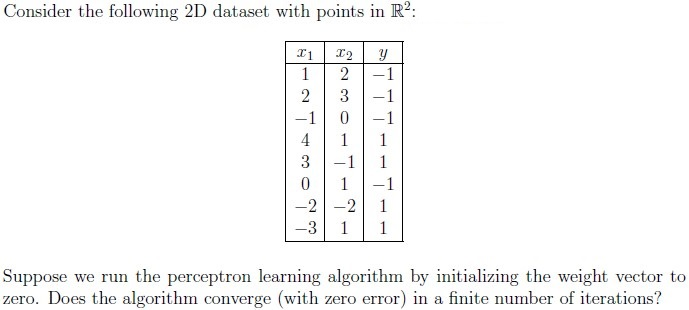
- Yes, it will converge.
- No, it will never converge.
- Insufficient data
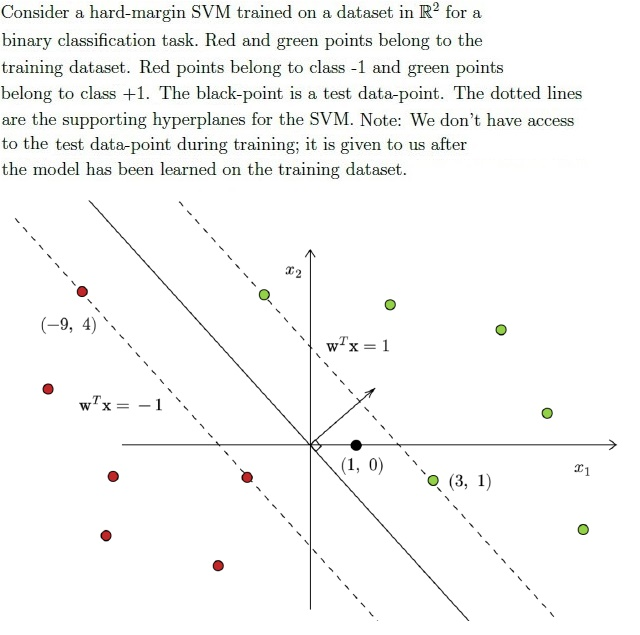
Comprehension passage - the questions below it refer to this
Based on the above data, answer the given subquestions.
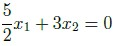
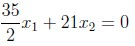
What is the equation of the decision boundary? Select all options that are correct.






Which of the following statements are correct?
- Overfitting models have high bias and low variance.
- Underfitting models have low bias and high variance.
- Generally, weak learners in the random forest tend to overfit.
- If the performance of each estimator in the bagging algorithm is almostidentical, the benefit of using bagging to combine them may be minimal or insignificant.
- In random forests, multiple decision trees (estimators) are trainedsimultaneously, allowing for parallel processing and faster model training.
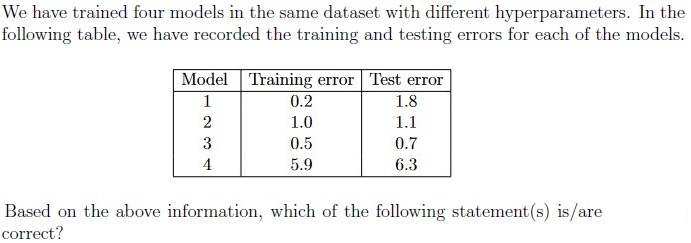
- Model 4 tends to overfit.
- Model 4 tends to underfit.
- Model 1 tends to underfit.
- Model 1 tends to overfit.





Answer key
- Q1 (MSQ, 5 marks): A, D
- Q2 (MCQ, 5 marks): C
- Q3 (MSQ, 6 marks): A, B
- Q4 (SA, 5 marks): 43.10 to 43.20
- Q5 (SA, 6 marks): 0.32 to 0.38
- Q6 (MSQ, 6 marks): A, D, E
- Q7 (MCQ, 6 marks): D
- Q8 (SA, 6 marks): 12
- Q9 (MCQ, 5 marks): C
- Q10 (MCQ, 5 marks): B
- Q11 (SA, 6 marks): 1
- Q12 (MSQ, 6 marks): A, C
- Q13 (SA, 5 marks): 5.32 to 5.44
- Q14 (MSQ, 6 marks): A, D
- Q15 (MSQ, 6 marks): C, D, E
- Q16 (MSQ, 5 marks): B, D
- Q17 (MSQ, 5 marks): A, C, D
- Q18 (SA, 6 marks): 4081
Concepts this paper tests
Auto-generated summary from the source site. Handy as a checklist; the lessons above explain each idea from scratch.
Here’s a structured summary of core topics, concepts, principles, and equations essential for the exam, followed by Mermaid knowledge graphs to visualize relationships.
Core Topics & Key Concepts
1. Dimensionality Reduction
Principal Component Analysis (PCA)
Linear PCA:
- Projects data onto orthogonal axes (principal components) that maximize variance.
- Reconstruction Error: Zero if
k = rank(data). For the given dataset (Q3),k = 3achieves zero error. - Covariance Matrix: Eigenvectors = principal directions; eigenvalues = variance along directions.
- Equation:
where = matrix of top- eigenvectors.
Kernel PCA:
- Non-linear extension using kernel trick (e.g., RBF, polynomial).
Key Points (Q4):
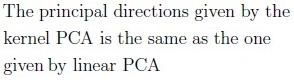
- Principal directions differ from linear PCA unless the kernel is linear.
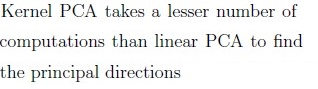
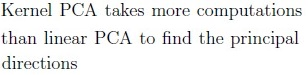
- Computationally more expensive than linear PCA (due to kernel matrix ).
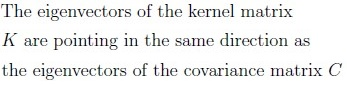
- Eigenvectors of are not the same as eigenvectors of covariance matrix .
Key Equations:
2. Clustering
Lloyd’s Algorithm (K-Means)
Steps:
- Initialize centroids (e.g., in Q5).
- Assign points to nearest centroid.
- Recompute centroids as mean of assigned points.
- Repeat until convergence.
- Convergence: Guaranteed (finite iterations), but may reach local optima.
- Final Centers Sum (Q5): After convergence, sum of centroids ≈ 43.15 (exact depends on ties).
Gaussian Mixture Models (GMM) & EM Algorithm
E-Step (Q6):
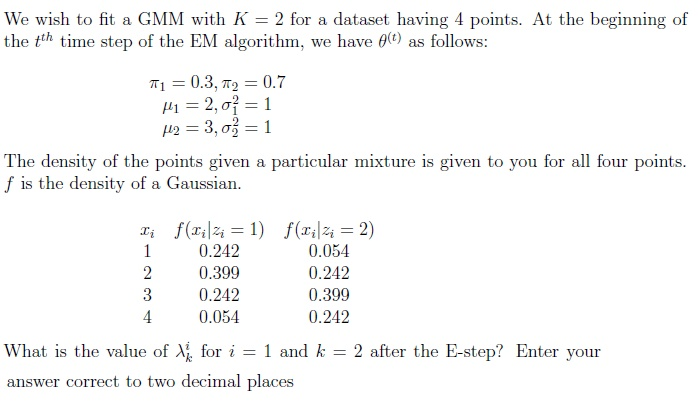
- Compute responsibilities () for each data point and cluster :
For , (given densities and priors).
- M-Step: Update using responsibilities.
3. Linear Regression & Regularization
Ordinary Least Squares (OLS)
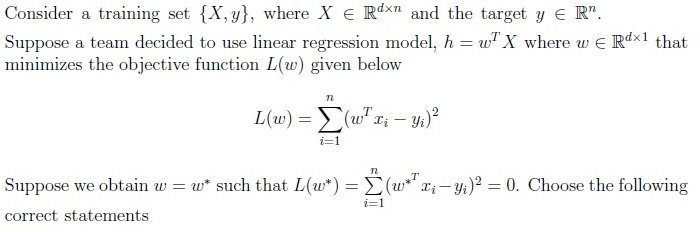
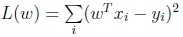
- Objective (Q7):
- Perfect Fit: If , the model interpolates all training points (implies is full-rank or is in the column space of ).
Ridge Regression (L2 Regularization)
- Objective:
- Solution (Q8):
Effect of :
- Higher → smaller weights (shrinks coefficients toward zero).
- Example: If , increasing to 8 likely reduces weights (e.g., option D: ).
4. Classification Algorithms
Decision Trees
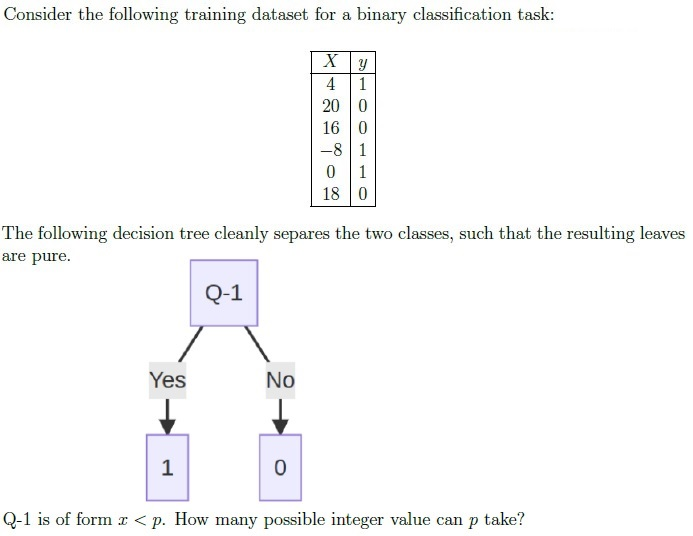
Splitting Rule (Q9):
- For binary classification, find threshold in that perfectly separates classes.
Possible Integer Values for :
- Sort unique values of , count midpoints between consecutive values where class labels change.
- For the given dataset, 12 possible integer thresholds.
Naive Bayes
- Prediction Rule (Q10):
- Insufficient Information: If priors and are unknown, cannot compute .
Perceptron Algorithm
Convergence (Q11):
- Converges only if data is linearly separable.
- Given dataset is not separable (e.g., point and have same label but lie on opposite sides of possible hyperplanes).
Logistic Regression
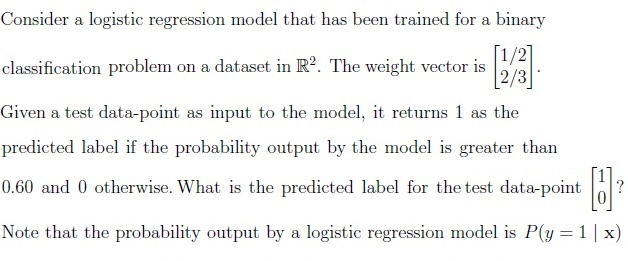
- Probability Output (Q12):
Decision Rule: Predict if .
- For and :
Support Vector Machines (SVM)
Hard-Margin SVM (Q13, Q14):
- Decision Boundary: .
- Supporting Hyperplanes: .
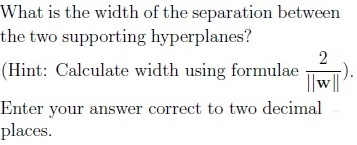
- Width of Margin:
For Q14, width ≈ 5.38 (given options).
- Equations of Boundaries (Q13):
- Scaled versions of (e.g., ).
Soft-Margin SVM (Q15):
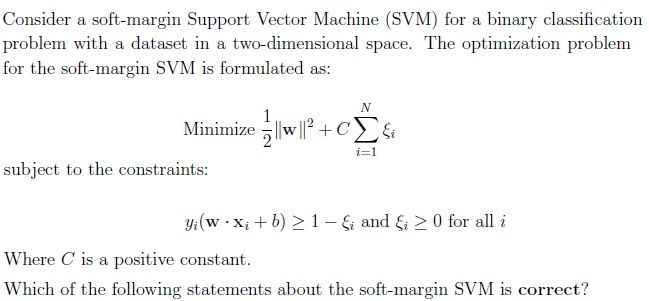
- Optimization:
Key Points:
- : Ignores margin violations (objective = 0 if data is separable).
- Constraints: total (one for each and one for the margin condition per point).
5. Model Evaluation & Ensemble Methods
Bias-Variance Tradeoff (Q16, Q17)
Overfitting:
- High variance, low bias (e.g., Model 1: training error = 0.2, test error = 1.8).
Underfitting:
- High bias, low variance (e.g., Model 4: training error = 5.9, test error = 6.3).
Bagging (Random Forest):
- Reduces variance by averaging multiple high-variance models (e.g., decision trees).
- Parallel Training: Trees are independent (can train simultaneously).
Loss Functions for Classification (Q18)
Suitable for Gradient Descent:
- Square Loss (OLS): (though not ideal for classification).
- Hinge Loss (SVM): .
- Modified Hinge: (margin maximization).
- Not Suitable: Sign function (non-differentiable).