Home / Past papers / MLP End Term / this paper
IIT M IMPROVEMENT AN EXAM QDD3 22 - 22 Dec 2024
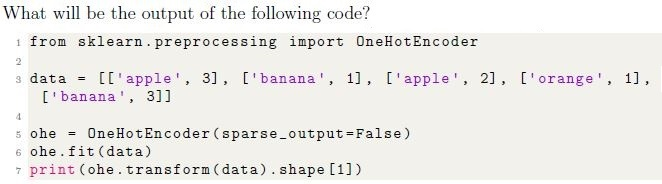
- 4
- 5
- 3
- 6
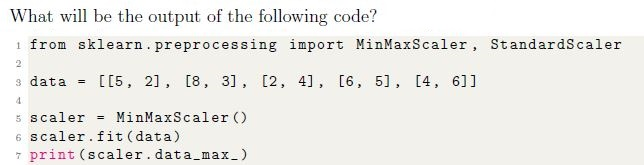
- [5, 6]
- [4, 5]
- [8, 6]
- [2, 3]





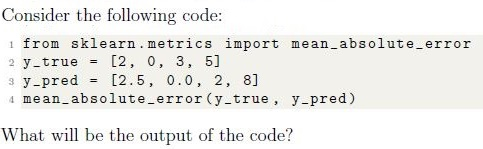
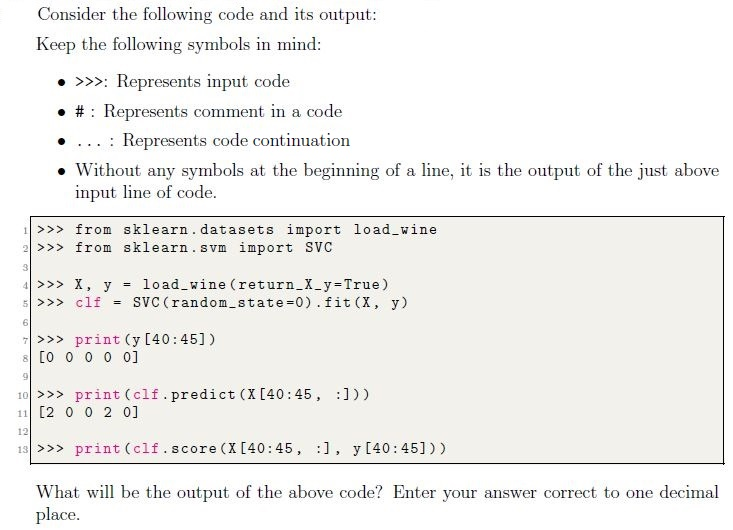
- 1.25
- 2.56
- 4.25
- 1.12
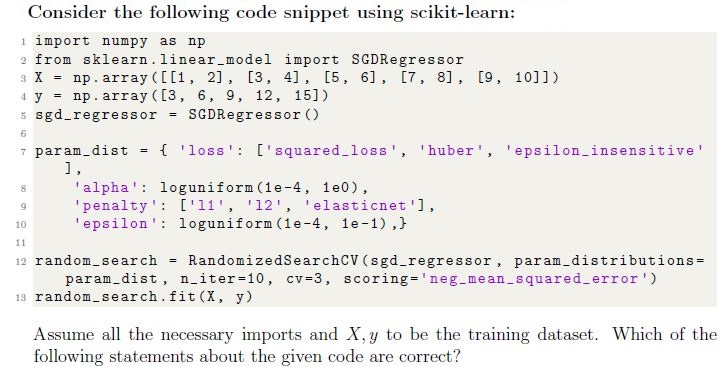
- Given code will return an error.
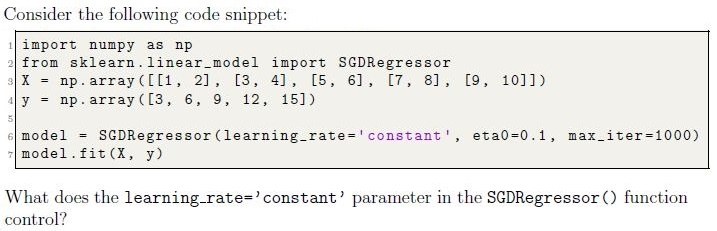
- It adjusts the learning rate based on the number of iterations.
- It defines the initial value for the learning rate and keeps it constantthroughout training.
- It determines the maximum step size allowed during training.
- It specifies the fraction of the dataset used for each step in the stochasticgradient descent.

- It determines the number of features to select for each base model.
- It controls the number of base learners (models) to train in the ensemble.
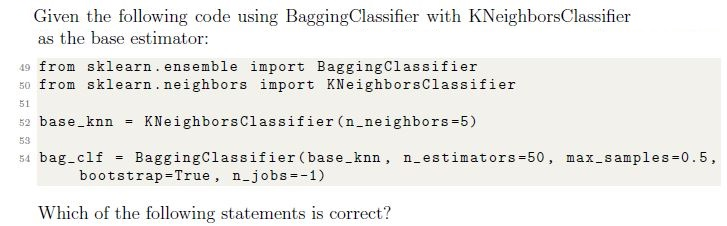
- It decides the maximum number of samples to use in each base model.
- It ensures randomness in the sample selection for each base model.
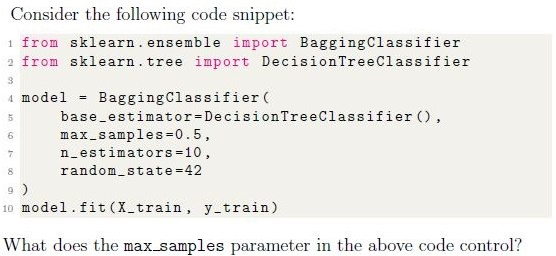
- The percentage of training samples used to train each base estimator.
- The number of base estimators trained on subsets of the training data.
- The maximum number of features used by each base estimator duringtraining.
- The total number of samples used to train all base estimators combined.

- It increases the variance among individual trees.
- It decreases the variance among individual trees.
- It reduces the number of samples used for training each tree.
- It reduces overfitting by restricting tree depth.
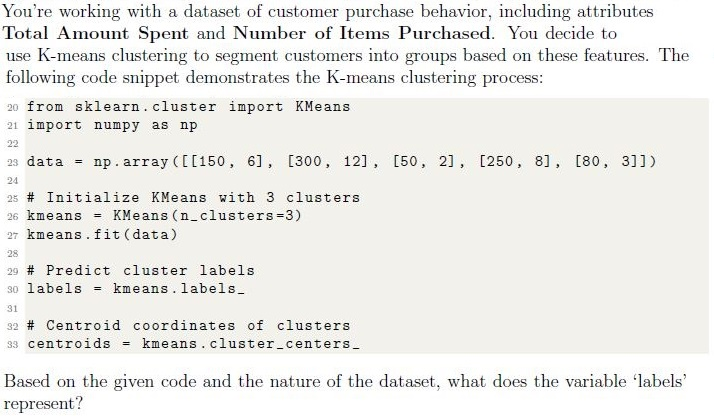
- The total amount spent by each customer.
- The cluster assignments indicating which group each customer belongs to.
- The number of items purchased by each customer.
- The centroid coordinates of the clusters formed.
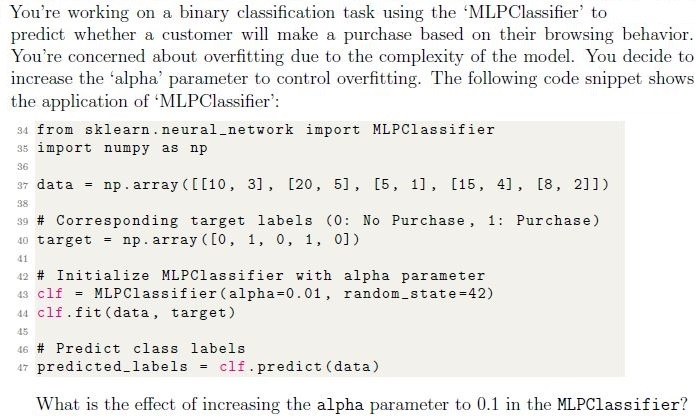
- It increases the model’s capacity to fit the training data closely, potentiallycausing overfitting.
- It adds a stronger regularization term to the loss function, reducing themodel’s complexity and helping prevent overfitting.
- It makes the model more prone to overfitting by increasing its sensitivity tonoise in the training data.
- It directly affects the learning rate, controlling how fast the model convergesduring training.
- Both statements are True
- Only statement 1 is True
- Only statement 2 is True
- Both statements are False









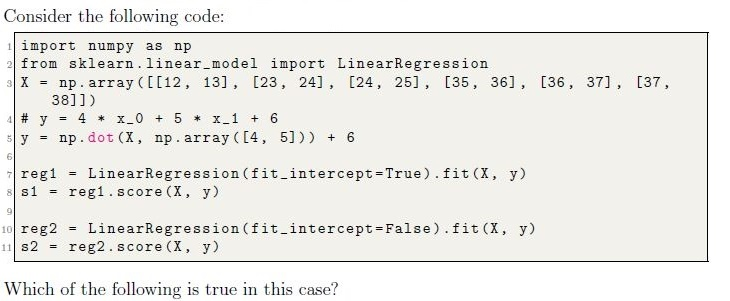
- s1 = s2
- s1 < s2
- s1 > s2
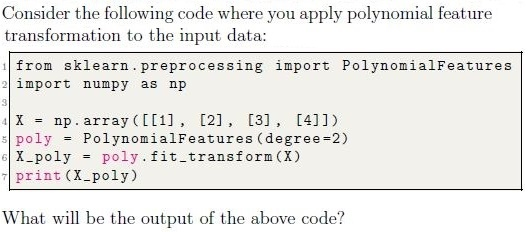

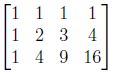

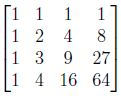

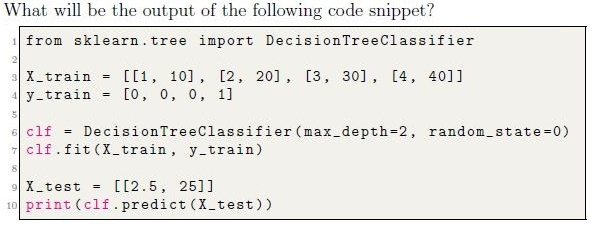
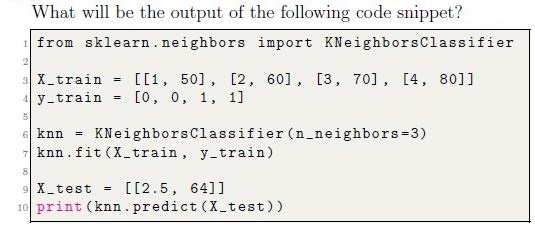
- [0]
- [1]
- [0.5]
- [2]
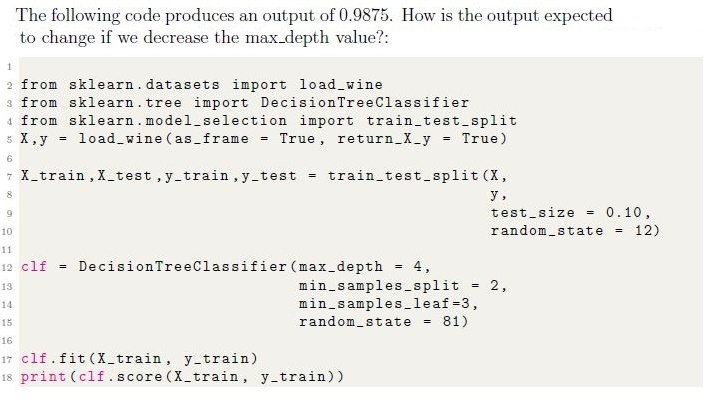
- Output score is likely to increase.
- Output score is likely to decrease.
- Output score may increase or decrease depending on other factors.
- Output score will remain the same.
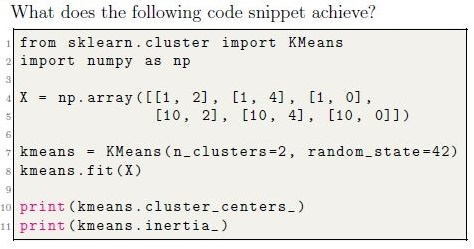
- Outputs the number of iterations and the final silhouette score of the clusters.
- Outputs the cluster labels for each data point and the maximum distancebetween clusters.
- Outputs the coordinates of the cluster centroids and the number of points ineach cluster.
- Outputs the coordinates of the cluster centroids and the sum of squareddistances of samples to their closest cluster center.
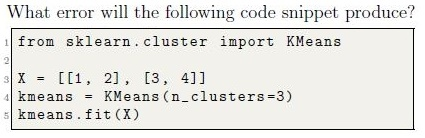











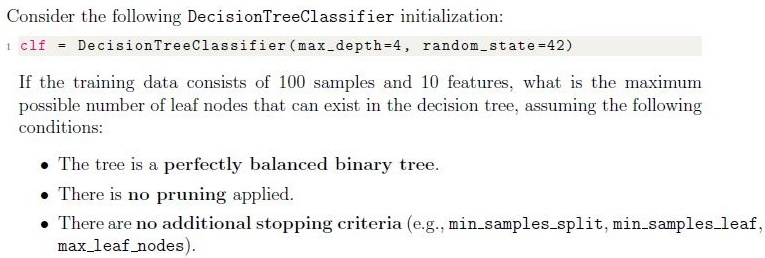
- 8
- 16
- 32
- 64
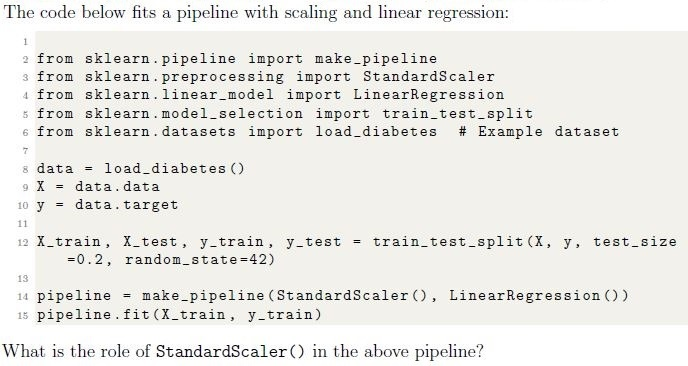
- PCA (Principal Component Analysis)
- StandardScaler
- Lasso Regression
- t-SNE (t-distributed Stochastic Neighbor Embedding)

- When data is streaming or generated incrementally.
- When the dataset is small.
- When the dataset cannot fit in memory.
- When the training labels are noisy.




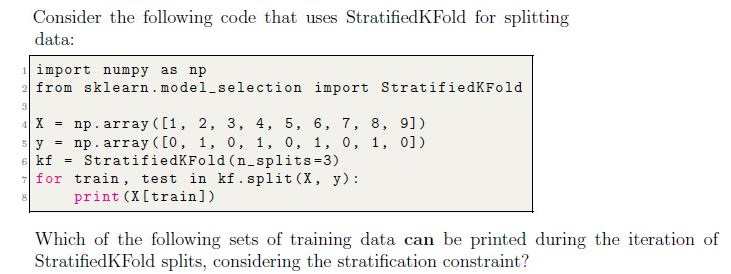
- [1, 2, 3, 6, 7]
- [1, 2, 3, 4, 5, 7]
- [2, 4, 6, 8]
- [1, 2, 3, 6, 8, 9]
- [2, 5, 8]
- [4, 5, 6, 7, 8, 9]
















- The neural network contains 3 hidden layers with 5 neurons in each hiddenlayer
- The neural network contains 5 hidden layers with 3 neurons in each hiddenlayer
- The neural network contains 2 hidden layers with 3 neurons in the secondhidden layer
- The neural network contains 2 hidden layers with 5 neurons in the first hiddenlayer
- None of the given options are correct
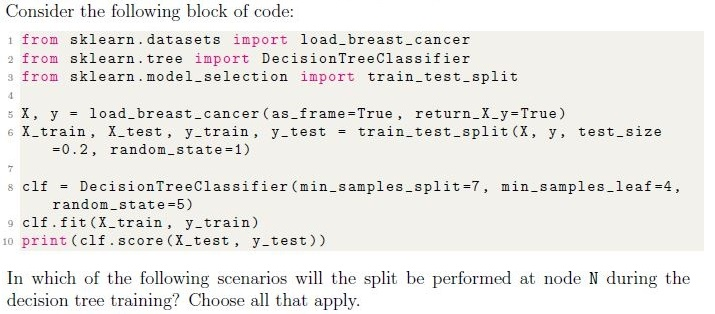
- The number of samples at node N is 15. If split, the left child will have 10samples, and the right child will have 5 samples.
- The number of samples at node N is 8. If split, the left child will have 4samples, and the right child will have 4 samples.
- The number of samples at node N is 9. If split, the left child will have 2samples, and the right child will have 7 samples.
- The number of samples at node N is 14. If split, the left child will have 4samples, and the right child will have 10 samples.
- The number of samples at node N is 6. If split, the left child will have 3samples, and the right child will have 3 samples.
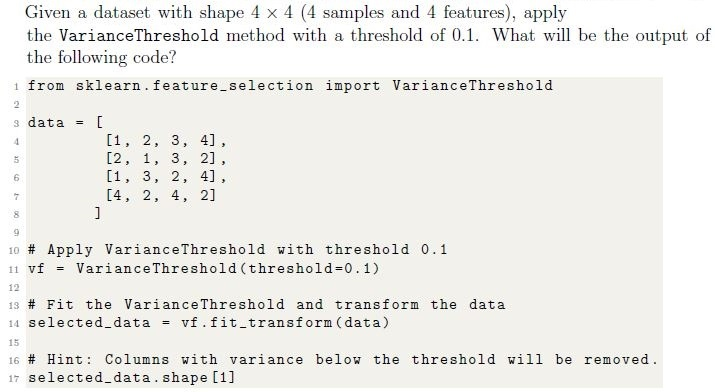
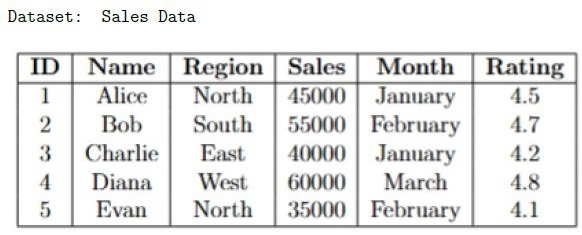













- The total sales for each region.
- The average sales for each month.
- The average sales for each region.
- None of these.
Answer key
- Q1 (MCQ, 2 marks): D
- Q2 (MCQ, 2 marks): C
- Q3 (MCQ, 2 marks): B
- Q4 (MCQ, 2 marks): D
- Q5 (MCQ, 2 marks): B
- Q6 (MCQ, 2 marks): B
- Q7 (MCQ, 2 marks): A
- Q8 (MCQ, 2 marks): B
- Q9 (MCQ, 2 marks): B
- Q10 (MCQ, 2 marks): B
- Q11 (MCQ, 2 marks): B
- Q12 (MCQ, 3 marks): B
- Q13 (MCQ, 3 marks): A
- Q14 (MCQ, 3 marks): A
- Q15 (MCQ, 3 marks): A
- Q16 (MCQ, 3 marks): A
- Q17 (MCQ, 3 marks): B
- Q18 (MCQ, 3 marks): D
- Q19 (MCQ, 3 marks): C
- Q20 (MCQ, 3 marks): C
- Q21 (MCQ, 3 marks): D
- Q22 (MCQ, 4 marks): B
- Q23 (MSQ, 2 marks): A, C, D
- Q24 (MSQ, 2 marks): A, C
- Q25 (MSQ, 3 marks): A, C, D
- Q26 (MSQ, 3 marks): B, D, F
- Q27 (MSQ, 3 marks): A, C, D
- Q28 (MSQ, 3 marks): A, C, D
- Q29 (MSQ, 3 marks): A, B, C
- Q30 (MSQ, 3 marks): C, D
- Q31 (MSQ, 4 marks): A, B, D
- Q32 (SA, 3 marks): 4
- Q33 (SA, 3 marks): 0.6
- Q34 (SA, 3 marks): 0
- Q35 (MCQ, 2 marks): A
- Q36 (MSQ, 2 marks): A, B, C
- Q37 (MSQ, 3 marks): A, C, D
- Q38 (MCQ, 2 marks): C
Concepts this paper tests
Auto-generated summary from the source site. Handy as a checklist; the lessons above explain each idea from scratch.
Here’s a structured summary of core topics, concepts, principles, and equations essential for the exam, followed by Mermaid knowledge graphs to visualize relationships.
Core Topics & Concepts
1. Data Preprocessing
Key Concepts:
One-Hot Encoding (
OneHotEncoder)- Converts categorical features into binary columns.
- Example:
['apple', 'banana']→[1, 0](apple),[0, 1](banana). Equation:
- If a categorical feature has
kunique values, one-hot encoding produceskbinary columns. - Total columns after encoding =
k (categorical) + m (numerical).
- If a categorical feature has
Feature Scaling (
MinMaxScaler,StandardScaler)MinMaxScaler: Scales features to
[0, 1]range.- Equation:
StandardScaler: Standardizes features to have
mean=0andstd=1.- Equation:
- Where = mean, = standard deviation.
Handling Missing Data (
dropna)thresh=N: Drops rows with fewer thanNnon-null values.- Example:
df.dropna(thresh=15)keeps rows with ≥15 non-null values.
Polynomial Features (
PolynomialFeatures)- Generates interaction terms and polynomial features.
- Example:
degree=2for[a, b]→[1, a, b, a², ab, b²]. - Output shape: If input has
nfeatures, output has features.
2. Model Evaluation
Key Metrics:
Mean Absolute Error (MAE)
- Equation:
R² Score (Coefficient of Determination)
- Equation:
Accuracy, Precision, Recall, F1-Score, ROC-AUC
- Used for classification tasks.
- ROC-AUC: Area under the Receiver Operating Characteristic curve (for binary classification).
Cross-Validation (
cross_val_score)- Evaluates model performance across multiple folds.
- Example:
cross_val_score(model, X, y, cv=5, scoring='roc_auc').
3. Supervised Learning Algorithms
Key Models:
Linear Regression (
LinearRegression)- Equation:
fit_intercept=True: Includes (bias term).
Decision Trees (
DecisionTreeClassifier)Hyperparameters:
max_depth: Maximum depth of the tree.min_samples_split: Minimum samples required to split a node.min_samples_leaf: Minimum samples required at a leaf node.
- Equation (Gini Impurity):
where = proportion of class .
Random Forest (
RandomForestClassifier)Hyperparameters:
n_estimators: Number of trees.max_features: Number of features to consider for splits (default:sqrt(n_features)).
Effect of
max_features:- Higher
max_features→ lower variance (more correlated trees). - Lower
max_features→ higher variance (more diverse trees).
- Higher
Gradient Boosting (
GradientBoostingClassifier)Hyperparameters:
learning_rate: Shrinkage factor for each tree’s contribution.n_estimators: Number of boosting stages.
- Equation (Boosting Update):
where = learning rate, = weak learner.
Support Vector Machines (SVM,
SVC)- Kernel Trick: Transforms data into higher dimensions for linear separation.
Hyperparameters:
C: Regularization parameter (trade-off between margin and misclassification).kernel:linear,rbf,poly.
k-Nearest Neighbors (k-NN,
KNeighborsClassifier)- Prediction: Majority vote (classification) or average (regression) of
knearest neighbors. - Distance Metrics: Euclidean, Manhattan, Minkowski.
- Prediction: Majority vote (classification) or average (regression) of
Neural Networks (
MLPClassifier,MLPRegressor)Hyperparameters:
hidden_layer_sizes: Tuple specifying neurons per layer (e.g.,(5, 3)= 2 hidden layers).alpha: L2 regularization strength (higheralpha→ stronger regularization).
Effect of
alpha:- Higher
alpha→ reduces overfitting (simpler model).
- Higher
4. Unsupervised Learning
Key Models:
k-Means Clustering (
KMeans)Hyperparameters:
n_clusters: Number of clusters.init: Initialization method (k-means++orrandom).max_iter: Maximum iterations.
Inertia: Sum of squared distances to nearest cluster center.
- Equation:
- Optimal
k: Elbow method (plot inertia vs.k).
Principal Component Analysis (PCA)
- Dimensionality Reduction: Projects data onto orthogonal axes (principal components).
- Variance Explained: First PC captures maximum variance.
5. Ensemble Methods
Key Techniques:
Bagging (
BaggingClassifier)Hyperparameters:
n_estimators: Number of base models.max_samples: Fraction of samples per base model (e.g.,0.5= 50%).
Effect of
max_samples:- Lower
max_samples→ higher diversity (reduces overfitting).
- Lower
Boosting (
AdaBoostClassifier,GradientBoostingClassifier)- AdaBoost: Weights misclassified samples higher in subsequent iterations.
- Gradient Boosting: Fits new models to residuals of previous models.
- Random Forest vs. Gradient Boosting: | Feature | Random Forest | Gradient Boosting | |-----------------------|----------------------------------------|-------------------------------------| | Bias-Variance | High variance, low bias | Low bias, high variance | | Training | Parallel (bagging) | Sequential (boosting) | | Hyperparameters |
n_estimators,max_features|learning_rate,n_estimators|
6. Model Selection & Hyperparameter Tuning
Key Methods:
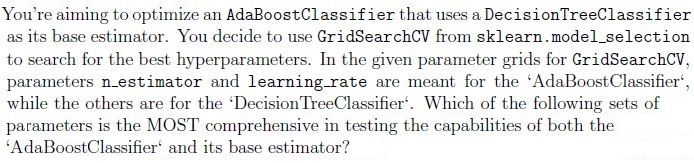
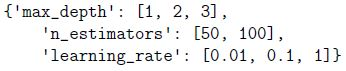
Grid Search (
GridSearchCV)- Exhaustively searches all parameter combinations.
Example:
param_grid = {'n_estimators': [50, 100], 'learning_rate': [0.1, 0.01]}
grid = GridSearchCV(GradientBoostingClassifier(), param_grid, cv=3)
Randomized Search (
RandomizedSearchCV)- Samples random parameter combinations (faster than grid search).
Example:
param_dist = {'alpha': loguniform(1e-4, 1e0), 'penalty': ['l1', 'l2']}
random_search = RandomizedSearchCV(SGDRegressor(), param_dist, n_iter=10)
Cross-Validation Strategies:
StratifiedKFold: Preserves class distribution in folds (for classification).KFold: Standard k-fold split.
7. Feature Selection & Dimensionality Reduction
Key Techniques:
Variance Threshold (
VarianceThreshold)- Removes low-variance features.
- Example:
VarianceThreshold(threshold=0.1).
PCA (Principal Component Analysis)
- Reduces dimensions while preserving variance.
- Equation (Covariance Matrix):
- Eigenvectors of = principal components.
Lasso Regression (L1 Regularization)
- Performs feature selection by shrinking coefficients to zero.
- Equation (Lasso Loss):
8. Clustering Evaluation
Key Metrics:
- Inertia (k-Means): Lower inertia → tighter clusters.
Silhouette Score: Measures cluster cohesion and separation.
- Equation:
where = mean intra-cluster distance, = mean nearest-cluster distance.
9. Incremental Learning (partial_fit)
Use Cases:
- Streaming Data: Update model incrementally without retraining on full dataset.
- Large Datasets: Train in mini-batches (e.g.,
SGDClassifier). Example:
model = SGDClassifier()
model.partial_fit(X_batch, y_batch, classes=[0, 1])
2. Supervised Learning
3. Unsupervised Learning
4. Ensemble Methods
5. Model Evaluation & Tuning
Key Equations Summary
| Concept | Equation |
|---|---|
| MinMax Scaling | |
| Standard Scaling | |
| MAE | |
| R² Score | |
| Gini Impurity | |
| Linear Regression | |
| Lasso Regression | |
| k-Means Inertia | |
| Silhouette Score | |
| Gradient Boosting |
Exam Tips
- Focus on Equations: Memorize key formulas (e.g., MAE, R², Gini, scaling).
Hyperparameters: Know the effect of parameters like:
n_estimators(ensemble methods),max_depth(decision trees),alpha(regularization),learning_rate(boosting).
- Preprocessing: Understand when to use
StandardScalervs.MinMaxScaler. - Evaluation Metrics: Match metrics to problems (e.g., ROC-AUC for imbalanced classification).
- Clustering: Know how to interpret inertia and silhouette scores.
- Incremental Learning: Recognize use cases for
partial_fit(streaming data, large datasets).