Home / Past papers / MLP End Term / this paper
IIT M FOUNDATION DIPLOMA FN EXAM QDF1 28 Apr 2024 - 28 Apr 2024
- Instruction has been mentioned above.
- This Instruction is just for a reference & not for an evaluation.
- There is a collection of photographs. Each photograph can have multipleanimals, e.g., cats, dogs and birds. Your model should indicate all the animals which are present.
- From appropriate weather data, your model must predict, averagetemperature and average humidity for next seven days.
- Predicting expected price of a second hand car with appropriate features.
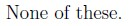
- None of these.




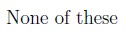
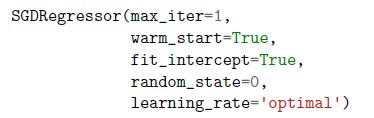
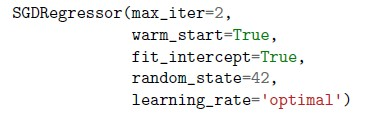
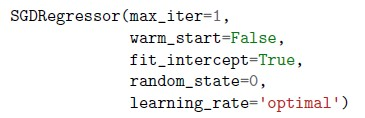
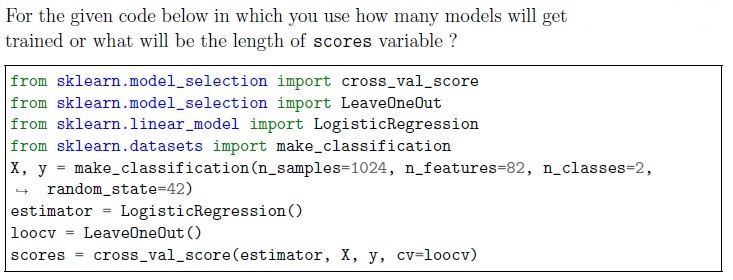
- 1106
- 82
- 1024
- 5
- None of these
- To split data into training and testing sets.
- To tune hyperparameters.
- To evaluate model performance on multiple subsets.
- To preprocess data.

- Statement 1 is True and Statement 2 is False
- Statement 2 is True and Statement 1 is False
- Both the statements are True
- Both the statements are False
- They are independent of each other.
- They are always a numerical representation of the text data.
- They are linearly related.
- They are categorical.
- None of these.
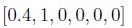
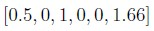


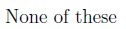
- Linear Regression
- Decision Tree
- K-means Clustering
- Support Vector Machine
- None of these

- Increasing the number of neurons in hidden layers will always lead to bettermodel performance.
- Decreasing the number of neurons in hidden layers reduces the model’scapacity to capture complex patterns.
- The number of neurons in hidden layers does not significantly affect themodel’s performance.
- Finding the optimal number of neurons is a trial-and-error process and mayrequire experimentation.
- It ignores outliers during the clustering process.
- It assigns outliers to the nearest cluster.
- It creates separate clusters for outliers.
- It removes outliers from the dataset before clustering.
- A hierarchical clustering technique that starts with each data point as itscluster and merges the closest clusters iteratively.
- A method for partitioning data into a predefined number of clusters.
- A clustering algorithm that uses centroids to iteratively assign data points toclusters.
- A dimensionality reduction technique that projects data onto a lower-dimensional space.
- Random initialization
- K-means++ initialization
- Hierarchical agglomerative initialization
- Weighted initialization

- The distance between cluster centroids
- The number of clusters formed
- Sum of squared distances of samples to their closest cluster center.
- The silhouette coefficient





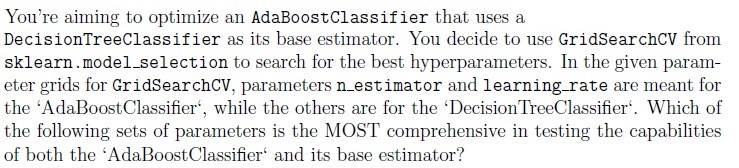

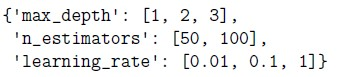

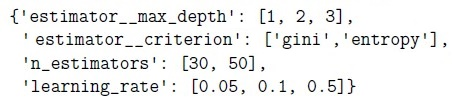
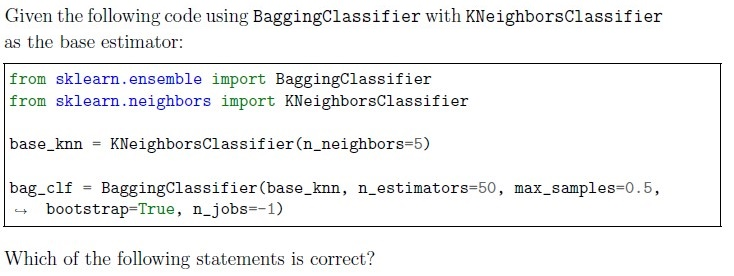




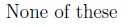





- To have less constraints/regularization
- To have more constraints/regularization
- Delete a significant portion of data
- Increase the dataset size.
- None of these.
- The more the SGD iterations, the lesser the fluctuations in training error.
- More iterations require more computation time.
- The tol (error tolerance) parameter restricts the number of iterationsperformed.
- Training error might not consistently decrease while performing SGDiterations.
- None of these
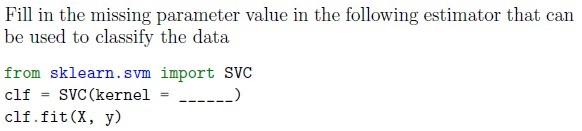





- It is a technique used to minimize the adjusted loss function and avoidunderfitting.
- It helps in increasing the bias of the training model.
- It determines the rows to be selected as a training dataset.
- Elastic net regularization is a combination of L1 and L2 regularization both.
- Entropy
- RoC Curve
- Cross Entropy
- Gini Impurity
- Plotting an Elbow curve.
- Using classifiers before making clusters.
- Plotting Silhouette coefficient for various values of k.
- Using k-fold cross validation
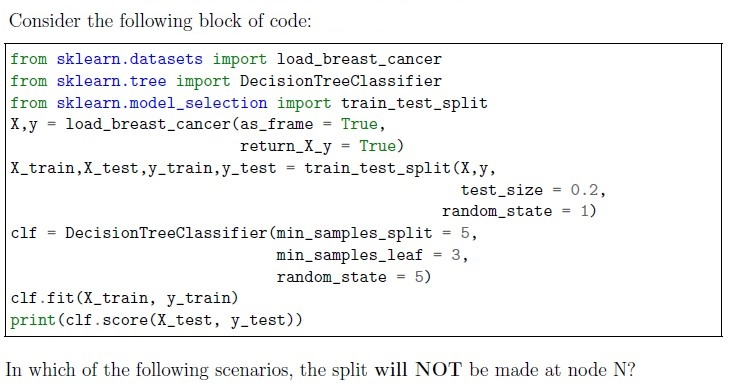
- 10 number of samples at node N. If it is split, it can split such that 2 samples inthe left child and 8 samples in the right child.
- 6 number of samples at node N. If it is split, it can split such that 3 samples inthe left child and 3 samples in the right child.
- 12 number of samples at node N. If it is split, it can split such that 5 samples inthe left child and 7 samples in the right child.
- 4 number of samples at node N. If it is split, it can split such that 3 samples inthe left child and 1 samples in the right child.
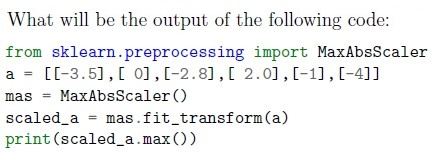
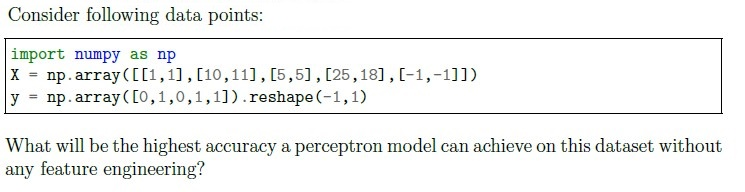
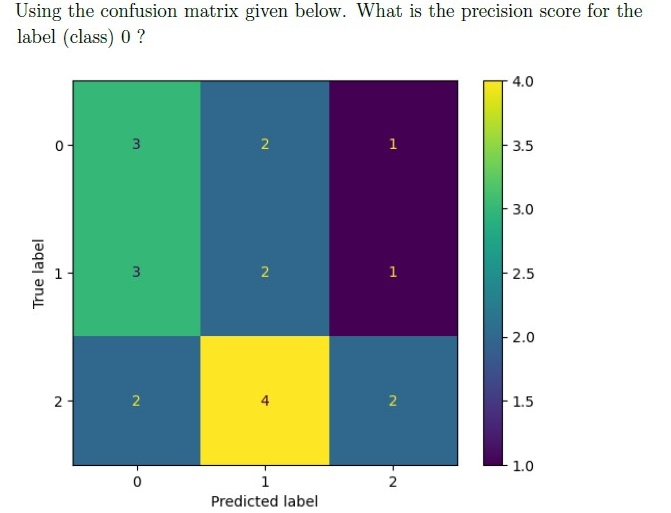
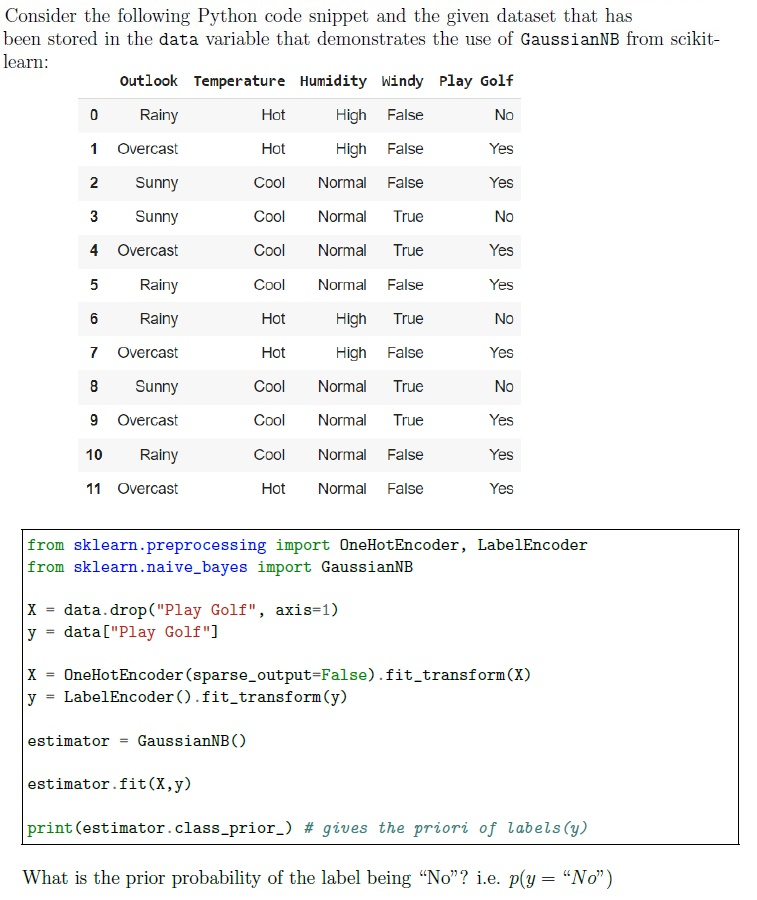
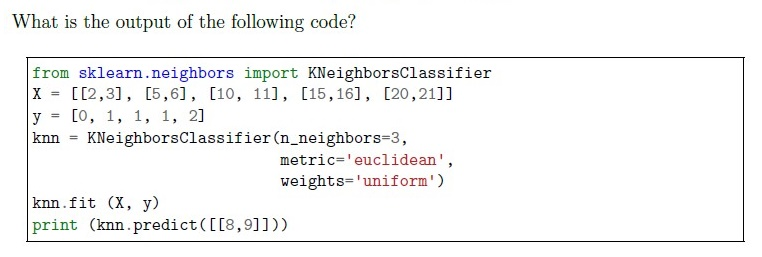
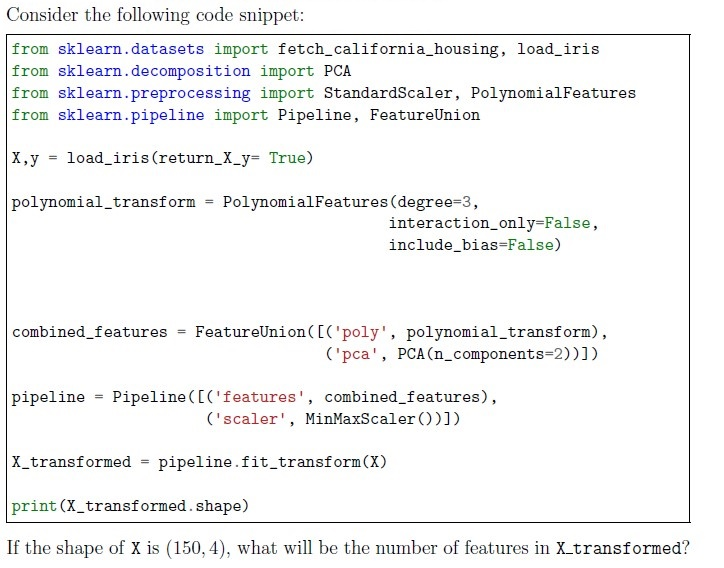
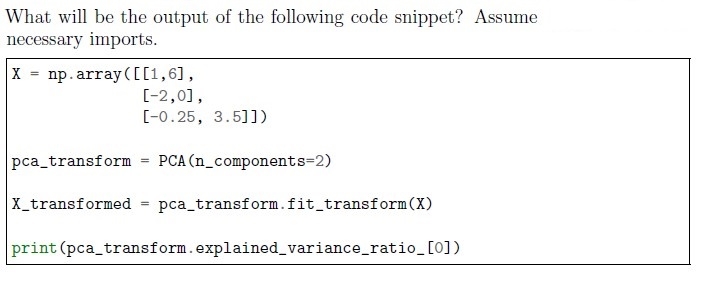
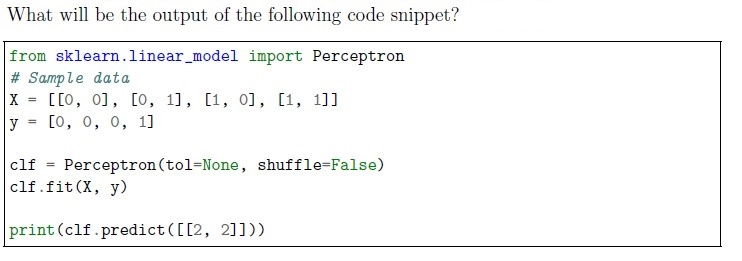
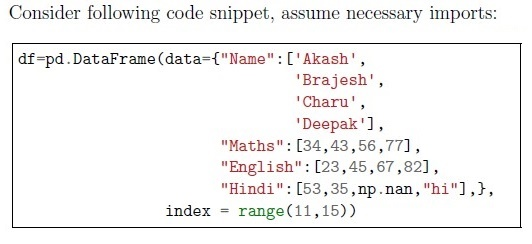
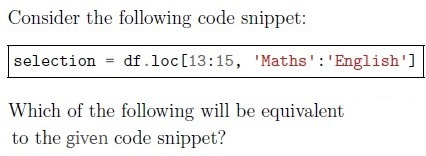




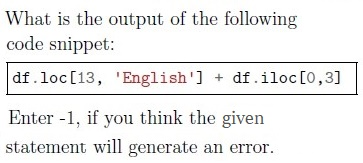
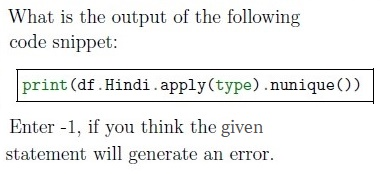
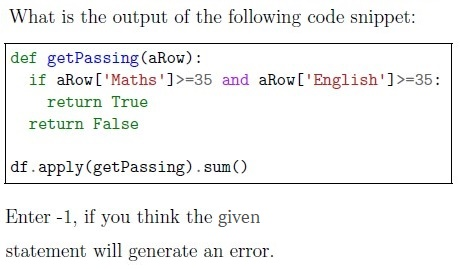
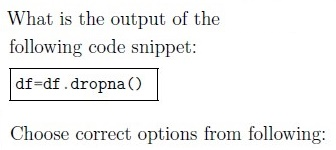
- The number of rows will decrease in the dataset.
- The number of columns will decrease in the dataset.
- The number of columns and number of rows, both, will decrease in thedataset.
- There will be no change.
- Insufficient information.
Answer key
- Q1 (MCQ, 0 marks): A
- Q2 (MCQ, 2 marks): A
- Q3 (MCQ, 2 marks): A
- Q4 (MCQ, 2 marks): A
- Q5 (MCQ, 2 marks): C
- Q6 (MCQ, 2 marks): C
- Q7 (MCQ, 2 marks): A
- Q8 (MCQ, 2 marks): A
- Q9 (MCQ, 3 marks): A
- Q10 (MCQ, 3 marks): C
- Q11 (MCQ, 3 marks): D
- Q12 (MCQ, 3 marks): B
- Q13 (MCQ, 3 marks): A
- Q14 (MCQ, 3 marks): B
- Q15 (MCQ, 3 marks): C
- Q16 (MCQ, 4 marks): A
- Q17 (MCQ, 4 marks): D
- Q18 (MCQ, 4 marks): C
- Q19 (MCQ, 4 marks): C
- Q20 (MSQ, 2 marks): B, D
- Q21 (MSQ, 2 marks): A, B, C, D
- Q22 (MSQ, 2 marks): B, C
- Q23 (MSQ, 2 marks): A, C
- Q24 (MSQ, 2 marks): B, D
- Q25 (MSQ, 3 marks): A, D
- Q26 (MSQ, 3 marks): A, C
- Q27 (MSQ, 4 marks): A, D
- Q28 (SA, 2 marks): 0.5
- Q29 (SA, 2 marks): 0.8
- Q30 (SA, 2 marks): 0.37 to 0.38
- Q31 (SA, 2 marks): 0.32 to 0.35
- Q32 (SA, 2 marks): 1
- Q33 (SA, 3 marks): 36
- Q34 (SA, 3 marks): 1.00
- Q35 (SA, 3 marks): 1
- Q36 (MSQ, 2 marks): A, C
- Q37 (SA, 2 marks): 120
- Q38 (SA, 2 marks): 3
- Q39 (SA, 2 marks): -1
- Q40 (MCQ, 2 marks): A
Concepts this paper tests
Auto-generated summary from the source site. Handy as a checklist; the lessons above explain each idea from scratch.
Here’s a structured summary of core topics, concepts, principles, and equations essential for the Diploma Level: Machine Learning Practices (Computer-Based Exam). The summary is organized by themes (e.g., Supervised Learning, Unsupervised Learning, Model Evaluation, Preprocessing, etc.), followed by a knowledge graph in Mermaid syntax to visualize relationships.
1. Core Topics & Concepts
A. Supervised Learning
1. Classification
Algorithms:
Logistic Regression:
- Assumes linear decision boundary.
- Uses sigmoid function for binary classification:
- Loss function: Log Loss (Cross-Entropy):
Naive Bayes:
- Assumes feature independence (conditional on class label).
- Types: Gaussian (continuous features), Multinomial (discrete counts), Bernoulli (binary features).
- Posterior probability:
Decision Trees:
Splits data based on impurity metrics:
- Gini Impurity:
- Entropy:
Hyperparameters:
max_depth,min_samples_split,min_samples_leaf,criterion(gini/entropy).- Support Vector Machines (SVM):
- Finds the optimal hyperplane to maximize margin.
- Kernels:
linear,rbf(Gaussian),poly. - Hinge Loss for SVMs:
k-Nearest Neighbors (k-NN):
- Classifies based on majority vote of
knearest neighbors. - Distance metrics: Euclidean, Manhattan.
- Curse of dimensionality: Performance degrades in high dimensions.
- Classifies based on majority vote of
Perceptron:
- Linear classifier with step function activation.
- Update rule:
- Converges only if data is linearly separable.
2. Regression
Algorithms:
Linear Regression:
- Model: .
- Loss: Mean Squared Error (MSE):
- Closed-form solution (Normal Equation):
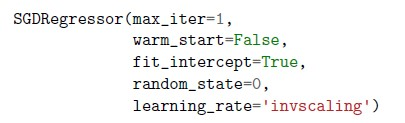
Stochastic Gradient Descent (SGD):
- Updates weights incrementally:
Hyperparameters:
learning_rate(eta0),max_iter,tol(tolerance for early stopping),shuffle(shuffle data each epoch).
Warm Start: Reuses previous solution for incremental learning.
- Regularization:
- L1 (Lasso):
- L2 (Ridge):
- Elastic Net: Combines L1 and L2.
- Purpose: Prevent overfitting by penalizing large weights.
3. Ensemble Methods
Bagging (Bootstrap Aggregating):
- Trains multiple models on bootstrapped samples and averages predictions.
- Example: Random Forest (uses decision trees with feature subsampling).
Hyperparameters:
n_estimators,max_features(subset of features per tree),bootstrap.
Boosting:
- Sequentially corrects errors of previous models.
- Example: AdaBoost (weights misclassified samples higher).
- Gradient Boosting: Fits new models to residual errors.
- Stacking: Combines predictions of multiple models using a meta-model.
B. Unsupervised Learning
1. Clustering
k-Means:
- Partitions data into
kclusters by minimizing inertia (within-cluster sum of squares):
- Partitions data into
- Initialization:
k-means++(better than random). - Elbow Method: Plot inertia vs.
kto find optimalk. Silhouette Score: Measures cluster separation/cohesion.
- Hierarchical Clustering:
- Agglomerative: Starts with each point as a cluster, merges closest clusters.
- Linkage Methods: Single, complete, average, Ward.
- Dendrogram: Visualizes cluster merges.
2. Dimensionality Reduction
Principal Component Analysis (PCA):
- Projects data onto orthogonal axes (principal components) maximizing variance.
- Explained variance ratio: Proportion of variance captured by each PC.
Feature Engineering:
- Polynomial Features: Generates interactions/non-linear terms.
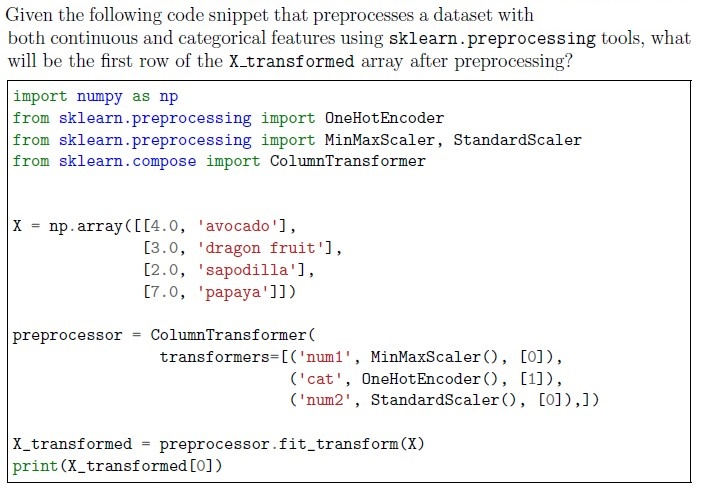
- One-Hot Encoding: Converts categorical features to binary vectors.
Scaling:
- StandardScaler: .
- MinMaxScaler: .
- MaxAbsScaler: Scales by maximum absolute value.
C. Model Evaluation
1. Metrics
Classification:
- Confusion Matrix: | | Predicted + | Predicted - | |---------------|-------------|-------------| | Actual + | TP | FN | | Actual - | FP | TN |
- Precision: .
- Recall: .
- F1-Score: Harmonic mean of precision/recall.
- Accuracy: .
Regression:
- MSE/RMSE, MAE, R² Score.
2. Cross-Validation
- k-Fold CV: Splits data into
kfolds, trains onk-1folds, tests on 1 fold. - Leave-One-Out (LOO): Extreme case of k-fold where
k = N(number of samples). - Stratified k-Fold: Preserves class distribution in folds.
3. Bias-Variance Tradeoff
- Underfitting: High bias (model too simple).
- Overfitting: High variance (model too complex).
Solutions:
- Regularization, cross-validation, ensemble methods, more data.
D. Preprocessing & Data Handling
1. Data Cleaning
- Handle missing values: Drop (
dropna) or impute (SimpleImputer). - Outliers: Detect using IQR or Z-score, then clip/remove.
2. Feature Transformation
- ColumnTransformer: Applies different transformers to different columns.
- Pipeline: Chains preprocessing and modeling steps.
3. Pandas Operations
Indexing:
loc: Label-based.iloc: Integer-based.
- Aggregations:
groupby,apply,sum,mean. - Handling Mixed Data:
apply(type)to check data types.
E. Neural Networks (MLP)
Multilayer Perceptron (MLP):
- Hidden layers with neurons and activation functions (ReLU, sigmoid).
Hyperparameters:
hidden_layer_sizes: Tuple specifying neurons per layer (e.g.,(100, 50)).activation:relu,tanh,logistic.solver:adam,sgd.
- Tuning: Grid search or random search over hyperparameters.
F. Special Topics
1. Multi-Label/Multi-Class Classification
- Multi-Label: Each sample can have multiple labels (e.g., animals in a photo).
- Multi-Class: Single label from >2 classes (e.g., digit classification).
2. Initialization Methods
- k-Means++: Better centroid initialization than random.
- Xavier/Glorot: Scales initial weights based on layer sizes (for neural networks).
3. Outlier Handling in Clustering
- Agglomerative Clustering: Assigns outliers to the nearest cluster.
2. Key Equations
| Topic | Equation |
|---|---|
| Logistic Regression | , |
| Log Loss | |
| Linear Regression | |
| MSE | |
| Normal Equation | |
| SGD Update | |
| L1 Regularization | |
| L2 Regularization | |
| Gini Impurity | |
| Entropy | |
| k-Means Inertia | |
| PCA Variance | |
| Perceptron Update | |
| Standard Scaling | |
| MinMax Scaling |
Graph 2: Unsupervised Learning Relationships
Graph 3: Model Evaluation & Preprocessing
Graph 4: Data Preprocessing
Graph 5: Ensemble Methods
Graph 6: Neural Networks (MLP)
4. Exam Tips
Focus Areas:
- Algorithms: Know when to use which (e.g., k-means for clustering, logistic regression for binary classification).
- Hyperparameters: Understand their impact (e.g.,
max_depthin decision trees,n_estimatorsin random forests). - Preprocessing: Scaling, encoding, and handling missing data are critical.
- Evaluation: Metrics and cross-validation strategies.
- Math: Equations for loss functions, regularization, and probability (e.g., Naive Bayes).
Common Pitfalls:
- Overfitting: Regularization, cross-validation, and ensemble methods help.
- Data Leakage: Ensure preprocessing (e.g., scaling) is done within cross-validation folds.
- Class Imbalance: Use
class_weight='balanced'or resampling techniques.
Coding:
- Know how to implement pipelines, column transformers, and grid search in
sklearn. - Understand how to interpret confusion matrices and classification reports.
- Know how to implement pipelines, column transformers, and grid search in
Pandas:
- Master
loc/iloc,groupby,apply, and handling mixed data types.
- Master
This summary covers 90% of the exam content. Use the knowledge graphs to visualize connections between topics, and focus on equations for mathematical questions. Good luck!