Home / Past papers / MLP End Term / this paper
IIT M DIPLOMA AN EXAM QDD3 13 Apr 2025 - 13 Apr 2025
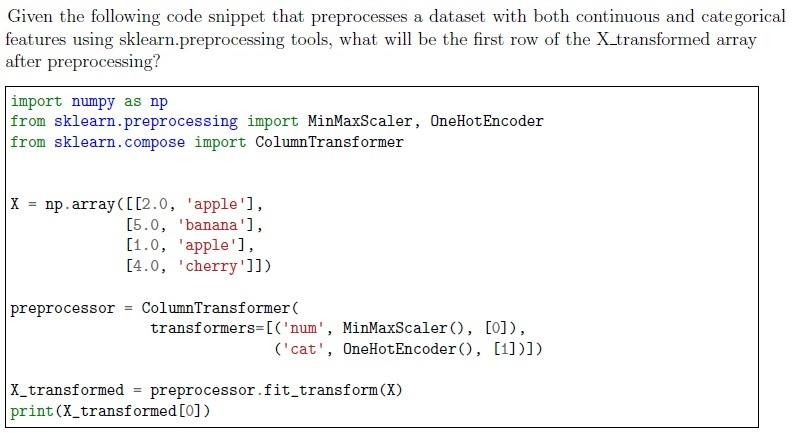
- [0.25, 1, 0, 0]
- [0.5, 0, 1, 0]
- [0, 1, 0, 0]
- [1, 0, 0, 1]
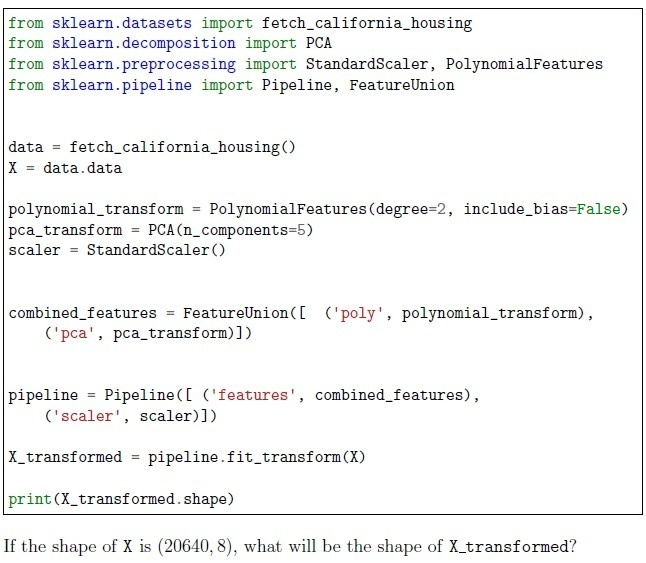 Consider the following code snippet:
- (20640, 8)
- (20640, 5)
- (20640, 44)
- (20640, 49)
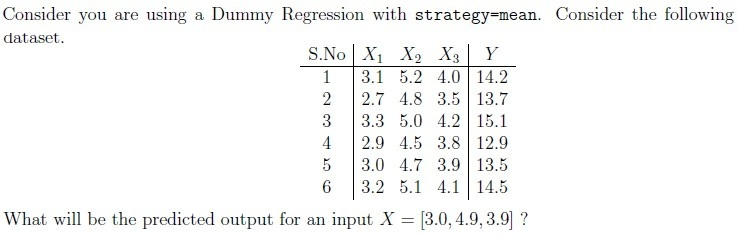
- 13.6
- 14.0
- 14.2
- 14.5
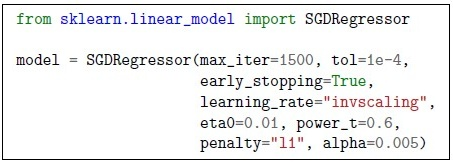
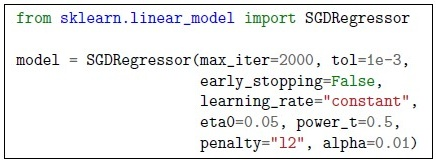
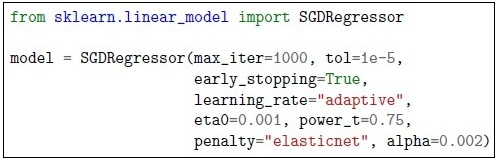
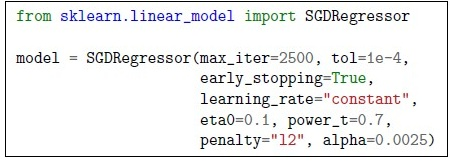
- Training the model.
- Choosing the best k value.
- Storing and searching through all training samples at prediction time.
- Calculating class probabilities.
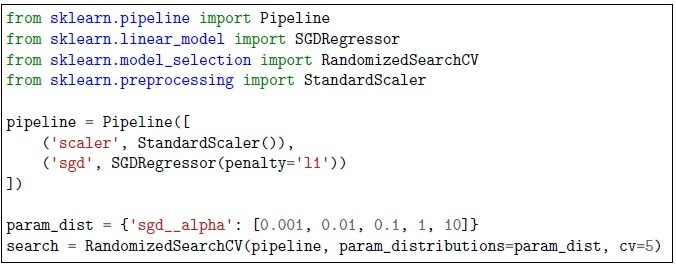
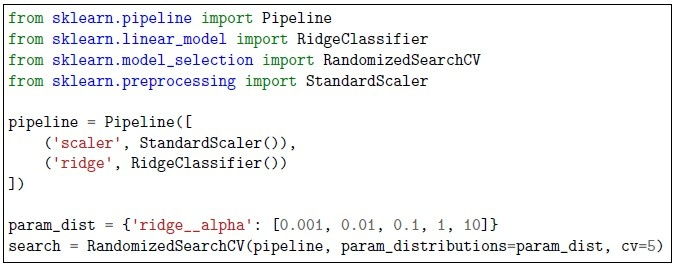
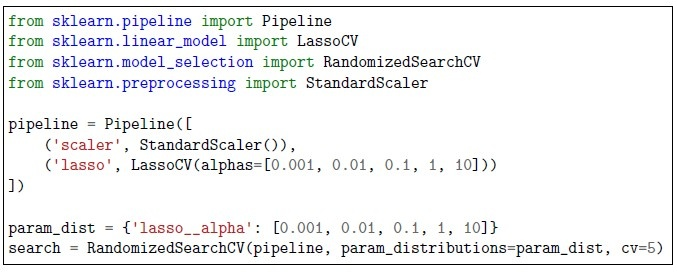
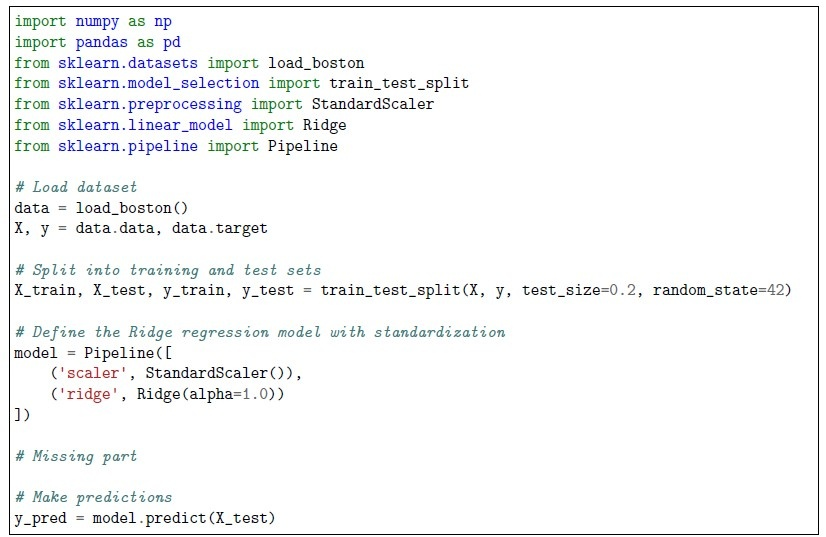 The following code attempts to implement Ridge regression on the Boston housing dataset but contains an error. The missing part should be correctly filled in to avoid issues during training.
Which of the following correctly fills the missing part while ensuring proper preprocessing?




- GridSearchCV
- ElasticNetCV
- SelectKBest
- Feature Scaling with StandardScaler
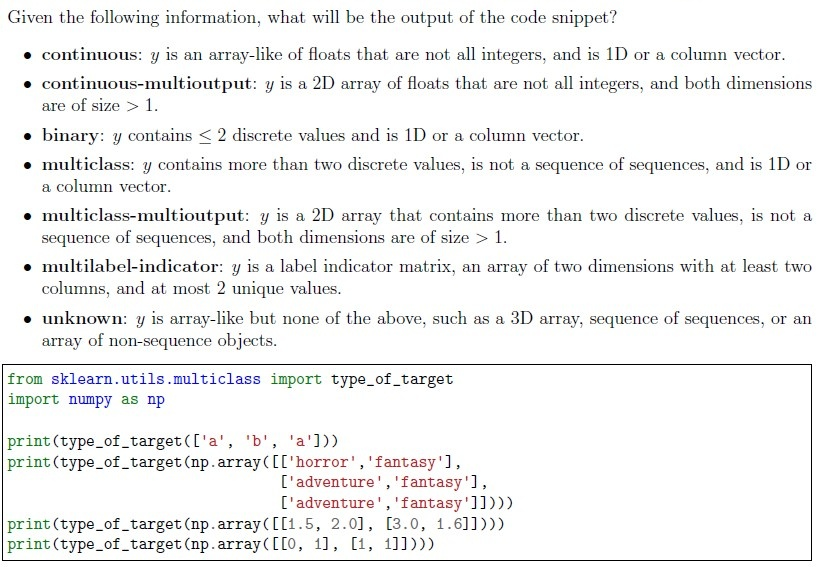
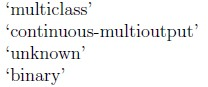
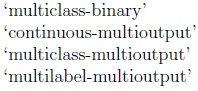
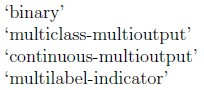
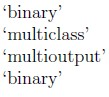





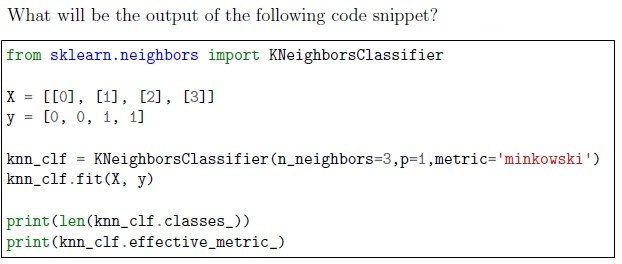
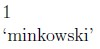

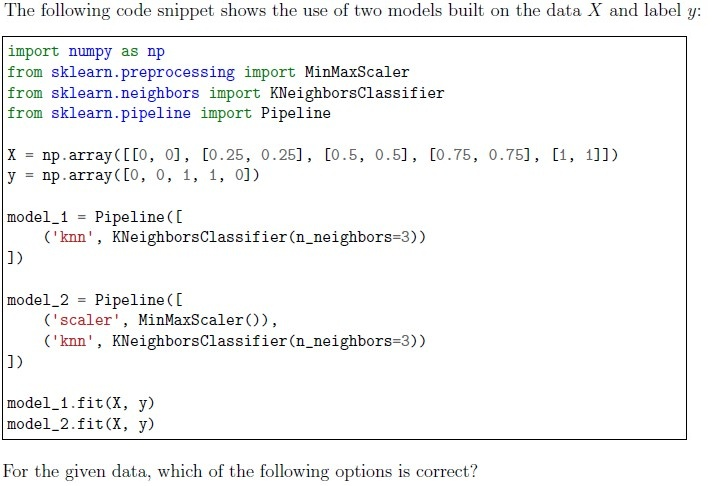










- It decides how many features are to be considered by each of the estimators
- It signifies the influence of each estimator towards the prediction
- It offers the order in which each estimator is considered before making aprediction
- It provides weights to different classes in a multiclass classification problem






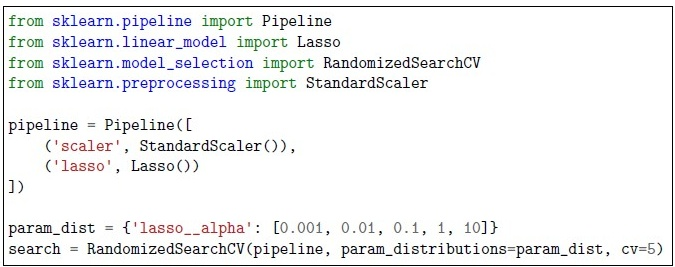
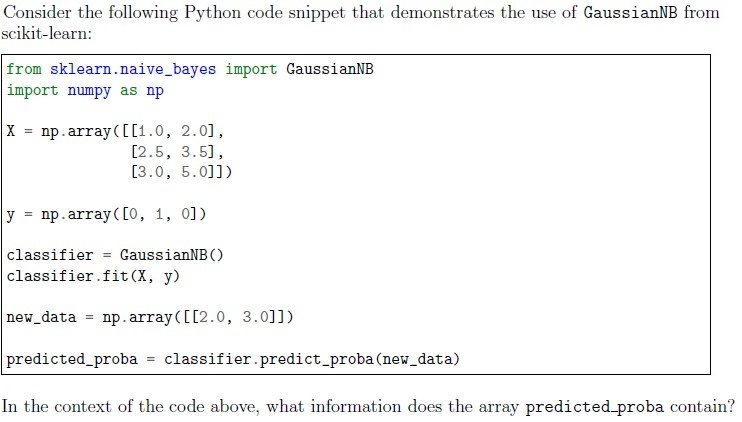
- The predicted classes for the new data points.
- The decision boundary values for the classes.
- The posterior probabilities of the classes for the new data points.
- The likelihood estimates for the new data points.
- The decision boundary of a logistic regression model is always a straight line.
- The solver parameter in logistic regression determines the optimizationalgorithm used for training the model.
- Logistic regression can naturally handle multi-class classification without anymodifications.
- The regularization strength in logistic regression can be controlled using the Cparameter.
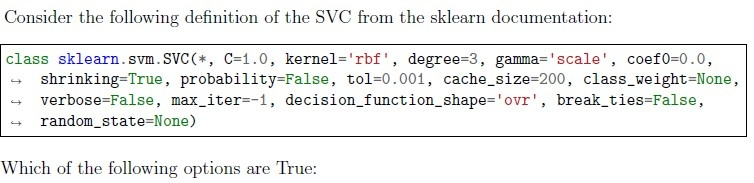









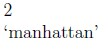
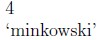
- Euclidean Distance
- Tree Distance
- Centroid Distance
- Minkowski Distance





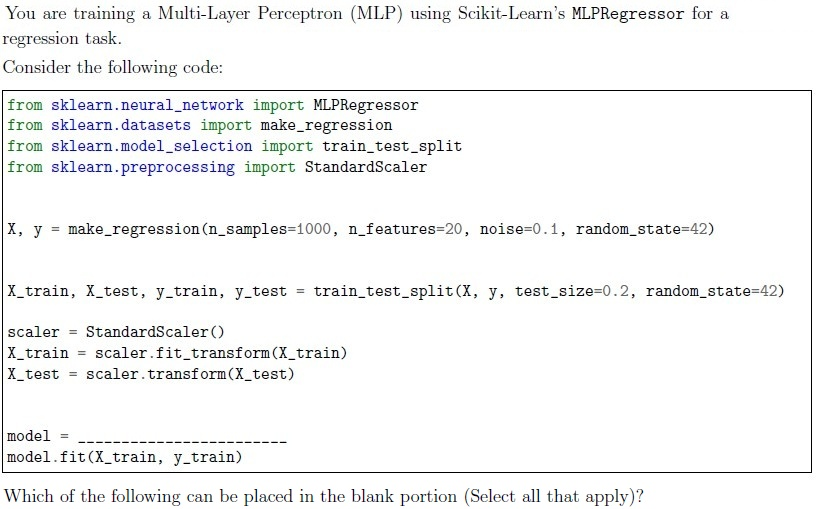
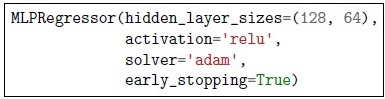
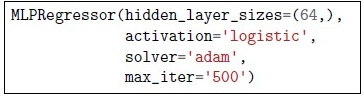
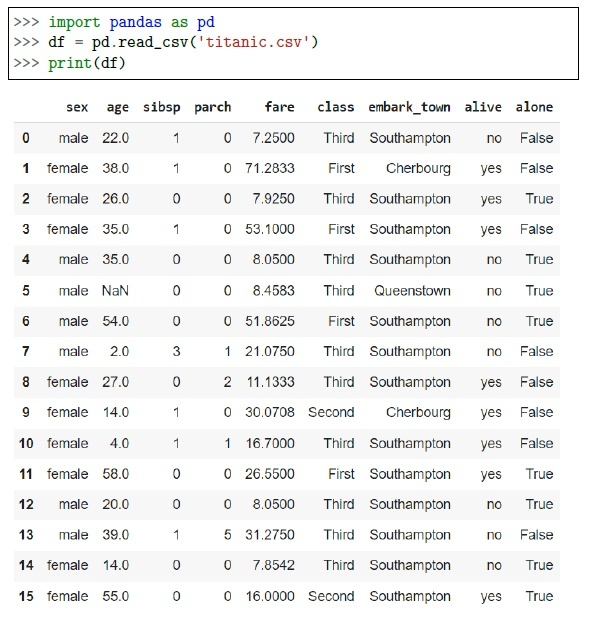
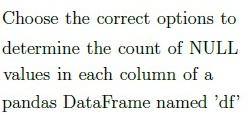




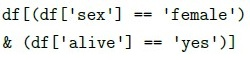
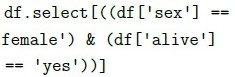
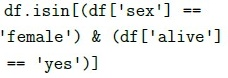
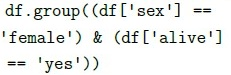
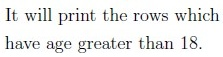
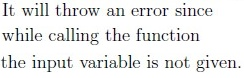
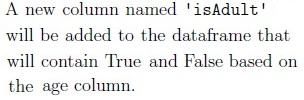
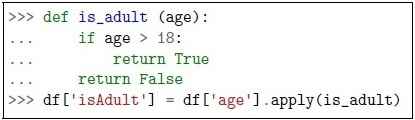 What is the given code below trying to accomplish for the given titanic dataset ?
- Both the assertion and reason are correct, and the reason is a correctexplanation of the assertion
- Both the assertion and reason are correct, but the reason is not a correctexplanation of the assertion.
- The assertion is correct, but the reason is incorrect.
- The assertion is incorrect, but the reason is correct.
Answer key
- Q1 (MCQ, 1 marks): A
- Q2 (MCQ, 1 marks): D
- Q3 (MCQ, 1 marks): B
- Q4 (MCQ, 1 marks): A
- Q5 (MCQ, 1 marks): C
- Q6 (MCQ, 2 marks): A
- Q7 (MCQ, 2 marks): A
- Q8 (MCQ, 2 marks): C
- Q9 (MCQ, 2 marks): B
- Q10 (MCQ, 2 marks): B
- Q11 (MCQ, 2 marks): C
- Q12 (MCQ, 2 marks): D
- Q13 (MCQ, 2 marks): B
- Q14 (MCQ, 2 marks): D
- Q15 (MCQ, 3 marks): B
- Q16 (MCQ, 3 marks): C
- Q17 (MSQ, 3 marks): B, D
- Q18 (MSQ, 2 marks): A, C
- Q19 (MSQ, 2 marks): A, B, C
- Q20 (MSQ, 2 marks): A, D
- Q21 (MSQ, 2 marks): A, C
- Q22 (MSQ, 1 marks): A, C
- Q23 (SA, 1 marks): 9.2
- Q24 (SA, 2 marks): 0.20
- Q25 (MCQ, 1 marks): A
- Q26 (MCQ, 1 marks): A
- Q27 (MCQ, 1 marks): C
- Q28 (MCQ, 1 marks): D
- Q29 (SA, 1 marks): 73
- Q30 (SA, 1 marks): 0.99
Concepts this paper tests
Auto-generated summary from the source site. Handy as a checklist; the lessons above explain each idea from scratch.
Here’s a structured summary of core topics, concepts, principles, and equations essential for the exam, followed by Mermaid knowledge graphs to visualize relationships.
Core Topics & Concepts
1. Data Preprocessing
Key Concepts:
Scaling/Normalization:
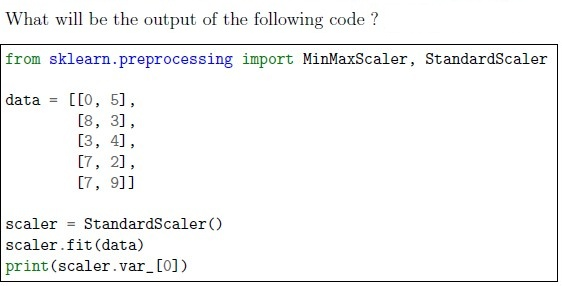
MinMaxScaler: Scales features to[0, 1]range.
StandardScaler: Standardizes features to mean=0, std=1.
Encoding Categorical Data:
OneHotEncoder: Converts categories into binary columns.LabelEncoder: Converts categories into integers (ordinal).
Polynomial Features:
- Generates interaction terms/non-linear features (e.g., ).
- Number of features for degree
dandnoriginal features:
PCA (Principal Component Analysis):
- Reduces dimensionality by projecting data onto orthogonal axes (principal components).
n_components: Number of PCs to retain.
Code Snippets:
from sklearn.preprocessing import MinMaxScaler, StandardScaler, OneHotEncoder, PolynomialFeatures
from sklearn.decomposition import PCA

### Example: Polynomial + PCA
poly = PolynomialFeatures(degree=2, include_bias=False)
pca = PCA(n_components=5)
2. Model Training & Evaluation
Key Concepts:
Dummy Regressor/Classifier:
strategy="mean": Predicts the mean ofy(regression).strategy="most_frequent": Predicts the mode ofy(classification).
K-Nearest Neighbors (KNN):
- Bottleneck: Prediction time (searches entire training set).
- Distance Metrics: Euclidean, Manhattan (
p=1in Minkowski), etc. effective_metric_: Returns the actual metric used (e.g., "manhattan").
Naïve Bayes:
- Assumes feature independence given the class.
Variants:
GaussianNB: Continuous data (assumes Gaussian distribution).BernoulliNB: Binary features.MultinomialNB: Discrete counts (e.g., text data).
- Outputs posterior probabilities (
predict_proba).
Logistic Regression:
- Solvers:
liblinear,lbfgs,saga(for small/large datasets). - Regularization: Controlled by
C(inverse of strength; smallerC= stronger regularization). - Multi-class: Uses
ovr(one-vs-rest) ormultinomial(softmax).
- Solvers:
Support Vector Machines (SVM):
- Kernels:
linear,poly,rbf,sigmoid. - Regularization:
C(trade-off between margin width and classification error). degree: Only used forkernel="poly".
- Kernels:
Random Forest:
Randomness Sources:
- Bootstrapping (
bootstrap=True). - Feature subset selection (
max_features < n_features).
- Bootstrapping (
- Out-of-Bag (OOB) Score: Estimates generalization error when
bootstrap=True. class_weight: Handles class imbalance.
AdaBoost:
- Overfitting Mitigation: Reduce
learning_rateorn_estimators.
- Overfitting Mitigation: Reduce
Stochastic Gradient Descent (SGD):
Learning Rate Schedules:
constant: Fixed rate (eta0).invscaling: Decays withpower_t.
adaptive: Adjusts based on loss.- Penalties:
l1(Lasso),l2(Ridge),elasticnet. - Early Stopping: Stops if validation score doesn’t improve by
tolforn_iter_no_changeiterations. - Hyperparameter Tuning:
GridSearchCV: Exhaustive search over a parameter grid.RandomizedSearchCV: Random sampling from a distribution.
- Penalties:
Evaluation Metrics:
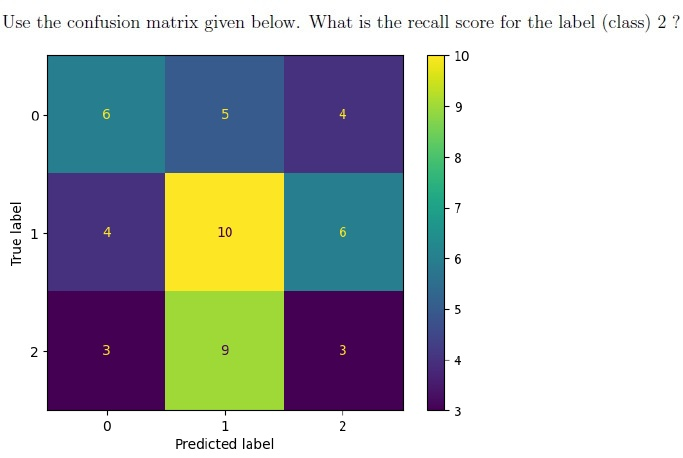
Confusion Matrix:
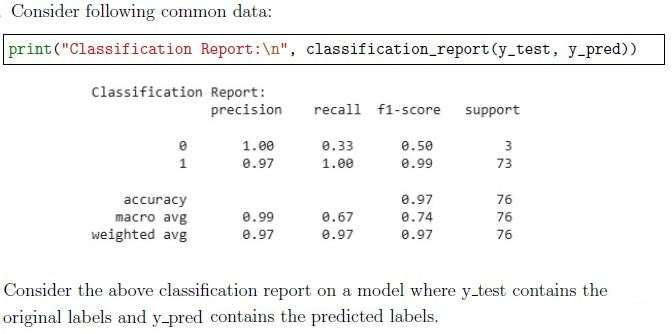
- Recall (Sensitivity):
- Precision:
F1-Score: Harmonic mean of precision and recall.
- Imbalanced Data: Accuracy can be misleading; use precision-recall curves or F1-score.
3. Clustering
Key Concepts:
K-Means:
- Initialization:
k-means++spreads centroids to avoid poor clusters. Optimal
k:- Elbow Method: Plot inertia (within-cluster sum of squares) vs.
k. - Silhouette Score: Measures cohesion/separation.
- Elbow Method: Plot inertia (within-cluster sum of squares) vs.
- Initialization:
Hierarchical Clustering:
- Linkage Metrics: Euclidean, Manhattan, centroid, etc.
- Agglomerative: Bottom-up merging of clusters.
4. Neural Networks (MLP)
Key Concepts:
MLPRegressor/Classifier:
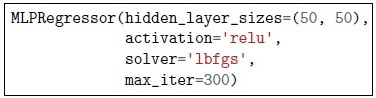
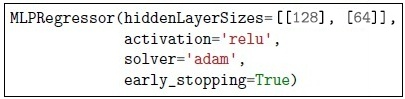
hidden_layer_sizes: Tuple specifying layers (e.g.,(100, 50)).activation:relu,logistic,tanh.solver:adam,lbfgs,sgd.early_stopping: Stops training if validation score doesn’t improve.
- Scaling: Critical for convergence (use
StandardScaler).
5. Ensemble Methods
Key Concepts:
Voting Classifier:
weights: Assigns importance to each model (e.g.,[1, 2, 3]).
Bagging (Random Forest):
- Reduces variance by averaging multiple models.
Boosting (AdaBoost):
- Sequentially corrects errors of weak learners.
6. Dimensionality Reduction
Key Concepts:
PCA:
- Transforms data into orthogonal components ordered by variance.
n_components: Number of PCs to retain.
Feature Union:
- Combines multiple feature transformations (e.g., PCA + polynomial features).
7. Model Interpretation
Key Concepts:
Feature Importance:
- Random Forest:
feature_importances_. - Linear Models: Coefficient magnitudes.
- Random Forest:
- Partial Dependence Plots: Shows relationship between a feature and predictions.
8. Handling Missing Data
Key Concepts:
Pandas:
df.isnull().sum(): Counts null values per column.df.dropna(): Drops rows/columns with nulls.df.fillna(): Imputes missing values.
9. Pandas Operations
Key Concepts:
Filtering:
df[(df['sex'] == 'female') & (df['alive'] == 'yes')]Applying Functions:
df['isAdult'] = df['age'].apply(lambda x: x >= 18)