Home / Past papers / MLP End Term / this paper
IIT M FOUNDATION DIPLOMA ENDTERM QPB2 07 Aug 2022 IBA - 07 Aug 2022
- Yes
- No
- Both loaders and fetchers generate controlled synthetic datasets
- Both loaders and fetchers return a Bunch object, which is a dictionary with twokeys
- Both techniques load small standard datasets
- None of these options are correct
- Enables different transformations on various columns of data based on theirtypes
- Combines output from several transformer objects by creating a newtransformer from them
- To chain multiple estimators to execute a fixed sequence of steps in datapreprocessing and modeling
- None of these
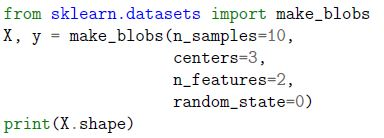 What will be the output of the following block of code?
- (10, 2)
- (2, 10)
- (10, 3)
- (3, 10)
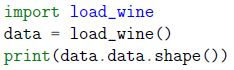



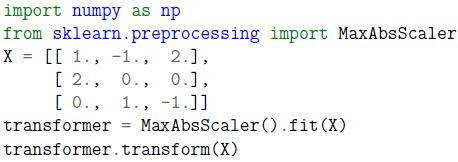 What is the output of the following block of code?
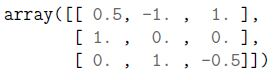
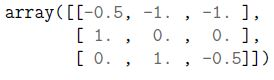
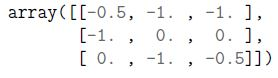
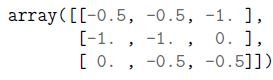
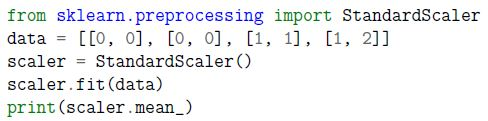 What is the output of the following code snippet?
- [0.75 0.5]
- [0.25 0.5]
- [0.5 0.75]
- [0.5 0.5]
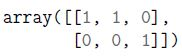
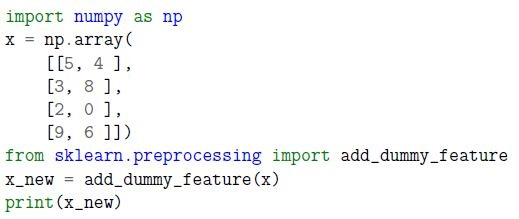 Which of the options will be the correct output for the following code snippet?

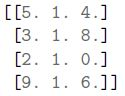
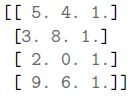
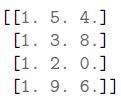
 Which of the options will be the correct output for the following code snippet?
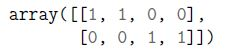
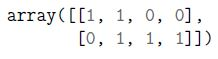
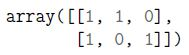
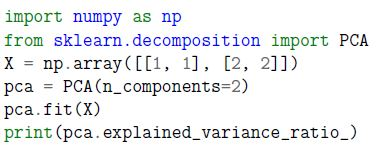 Which of the following options is correct explained variance score for the following code snippet applying PCA technique.
- [1. 1.]
- [1. 0.]
- [0. 1.]
- [0. 0.]
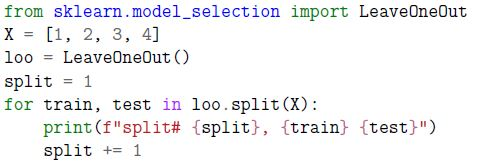 Which of the following options is the correct output of the following block of code?
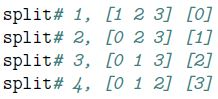
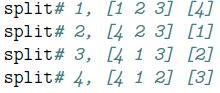
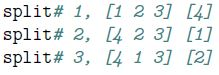
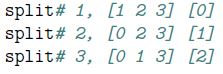



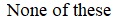
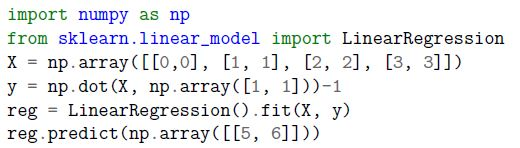 Which of the following options represent the correct output of the following block of code?
- array([9.])
- array([10.])
- array([11.])
- SyntaxError: unexpected EOF while parsing

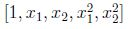

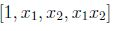

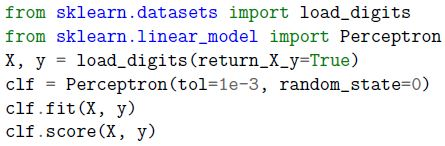 Which of the following options is the possible output for the following block of code?
- 0.94
- 1.25
- 1.94
- -2.64
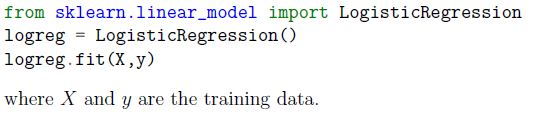 What operation does the following code implement?
- It will perform linear regression on the given data.
- It will generate synthetic regression data.
- It will generate synthetic classification data.
- It will perform classification on the given data.
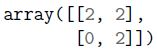
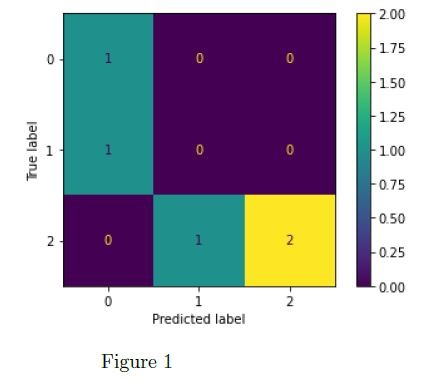 Which of the following options represent the recall value for the class 2 in the confusion matrix shown in Figure 1 if y_true = [0, 1, 2, 2, 2], y_pred = [0, 0, 2, 2, 1] ?
- 0.67
- 1.00
- 0.50
- 0.25
 Consider the following code block and mark the correct output.
- [0 0 0 1 1 1]
- [2 2 0 0 1 1]
- [0 1 2 0 1 2]
- [0 1 0 1 0 1]
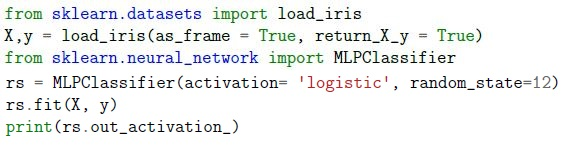 Consider X and y as the training dataset. What will be the output of the following code?
- logistic
- relu
- identity
- softmax
- Nonproliferation of classes
- Execution of all codes within 99.9 ms.
- Sensible defaults
- Direct accessibility of hyperparameters of all estimators
- Search for the best regularization rate with built-in cross validation in RidgeCVestimator
- Step 1: Instantiate object of Ridge estimator.Step 2: Set parameter alpha to the maximum regularization rate.
- Use cross validation with Ridge to search for best regularization.
- Apply cross validation with SGDRegressor for searching the best regularizationparameter.
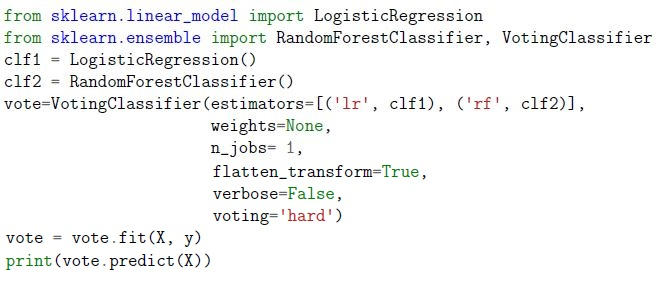 Consider the following block of code and mark all possible correct options.
- Given model uses majority voting rule to predict class labels.
- Given model predicts the class labels based on the argmax of the sums of thepredicted probabilities.
- Setting flatten_transform =True with voting=’soft’ will flatten the output shapeof transform.
- None of these are correct
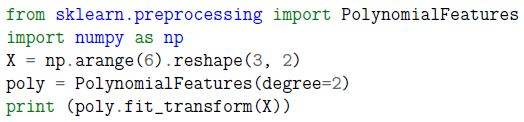 What will be the output of the following code block:
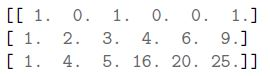
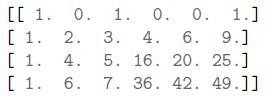
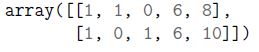
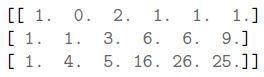
 Which of the following options represent the output of the following block of code?
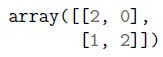
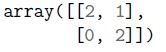
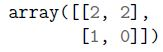
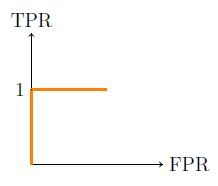 Which of the following statements will be true based on the following diagram?
- The classifier will predict all positive classes as negatives and all negativeclasses as positives.
- The classifier will perfectly distinguish between the positive and negativeclasses.
- There is a good probability that the classifier can properly identify the classes.
- We can not comment on the classifier performance based on the given figure
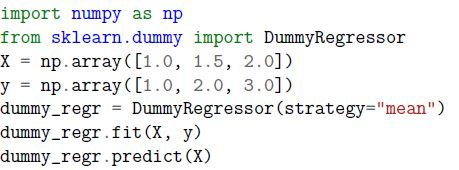 Which of the following options is the correct output of the following block of code?
- array([2.25, 2.25, 2.25])
- array([1., 1., 1.])
- array([2., 2., 2.])
- DummyRegressor()
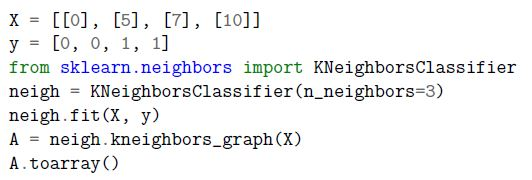 Which of the following is likely to be the correct output of the code given below?
- array([[1., 1., 1., 0.], [1., 1., 1., 0.], [0., 1., 0., 1.], [0., 1., 1., 1.]])
- array([[1., 1., 1., 0.], [1., 1., 1., 0.], [0., 1., 0., 1.], [0., 1., 0., 1.]])
- array([[1., 1., 0., 1.], [0., 1., 1., 0.], [0., 1., 1., 0.], [1., 0., 1., 1.]])
- array([[1., 1., 1., 0.], [1., 1., 1., 0.], [0., 1., 1., 1.], [0., 1., 1., 1.]])
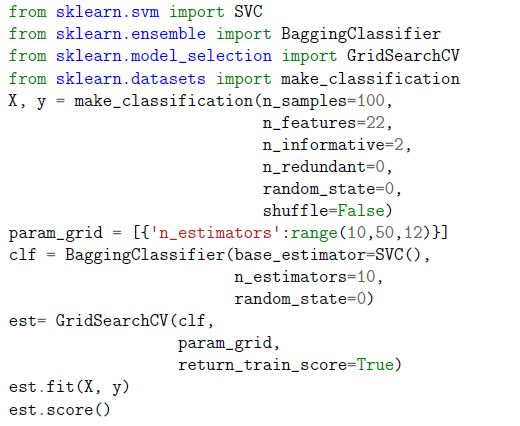
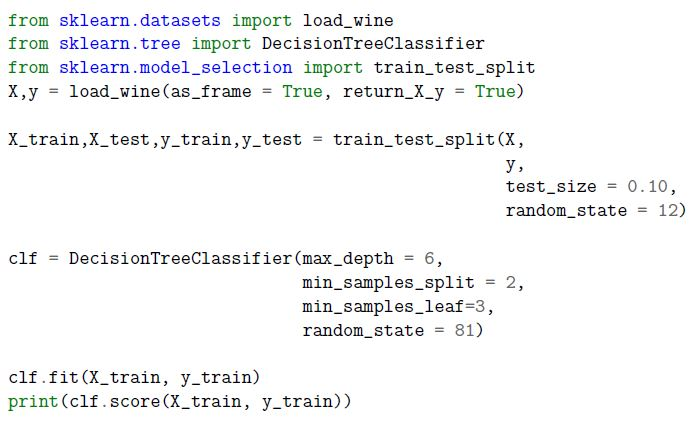 For the following block of code, we get the output as 0.9875. How would the output change if we decrease max depth value ?:
- Output score will definitely increase.
- Output score will definitely decrease.
- Output score may decrease or remain the same.
- Code will throw an error because max_depth can’t be less than 6.
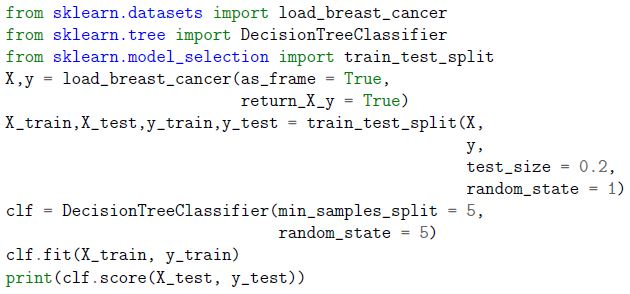 Consider the following block of code and mark the correct option.
- The minimum number of samples required to split a leaf node is 5.
- The minimum number of samples required to split an internal node is 6.
- The minimum number of samples required to be at a leaf node is 4.
- The minimum number of samples required to split an internal node is 5.
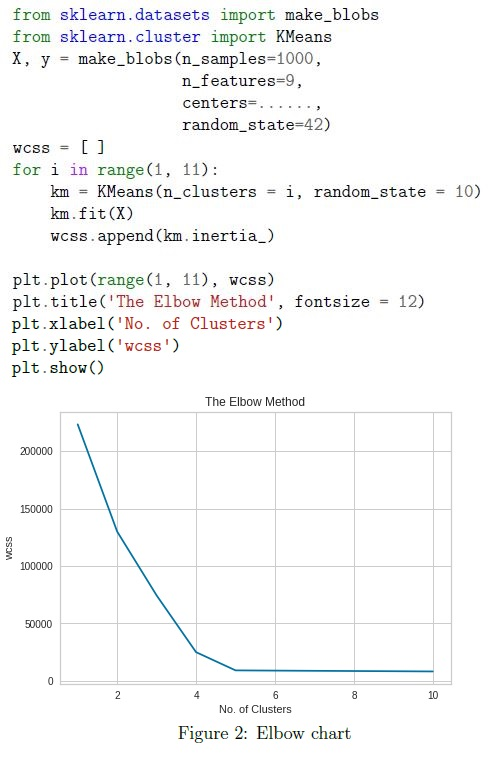 Consider the following code snippet. What value should we fill at the blank place, so that given code block creates graph as shown below:
- 2
- 4
- 5
- 6
- 10
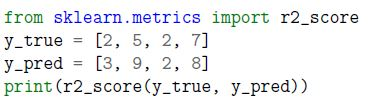 Calculate the coefficient of determination (R2) [up to 1 decimal point] based on the following block of code.
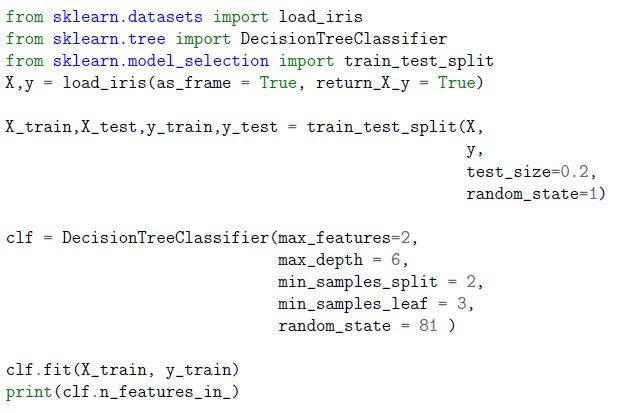 In the given block of code, the Iris dataset having shape (150,4) has been loaded for model training. What do you think will be the output of the code given below?
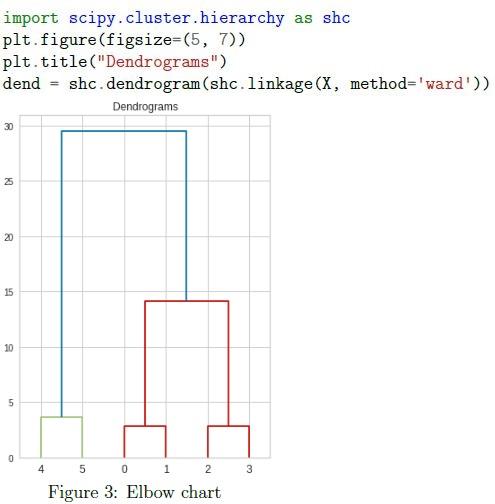 Code snippet written below plots a graph for some dataset X as shown below. In the given dendrogram which sample is most similar to the sample having label as 1 ?
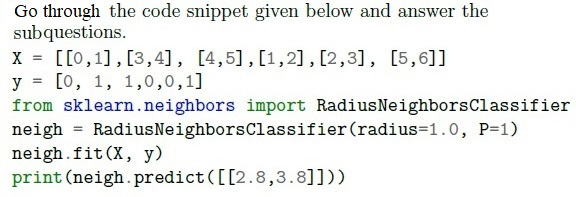
- [2]
- [0]
- [1]
- [3]
- Euclidean_distance
- Manhattan_distance
- Hamming Distance
- None of these
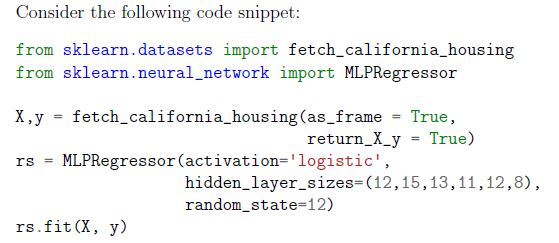
 What will be the output of the following code?
 What will be the output of the following code?
- (5, 12)
- (6, 11)
- (8, 15)
- (12, 8)
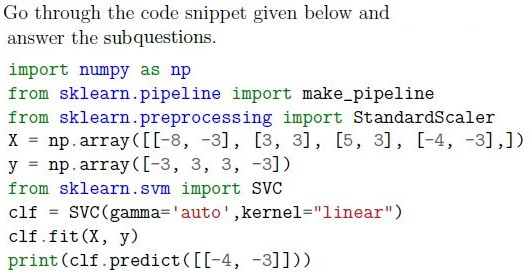
- [3]
- [-1]
- [1]
- [-3]
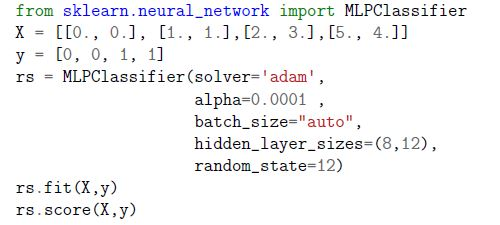
 Which of the following is likely to be the correct output:
- array([[-8., -3.], [ 3., 3.]])
- array([[-4., -3.], [ 3., 3.]])
- array([[-4., -3.], [ 5., 3.]])
- array([[-8., -3.], [ 5., 3.]])
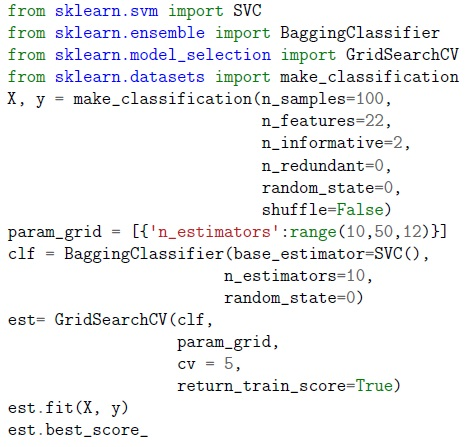
 Which of the following is/are true about the following block of the code?
- Given dataset belongs to binary classification.
- Number of neurons in the 1st hidden layer is 8.
- Strength of the L1 regularization term is 0.0001
- The activation function for the output layer in the given code is the ′logistic′function.

Answer key
- Q1 (MCQ, 0 marks): A
- Q2 (MCQ, 2 marks): B
- Q3 (MCQ, 2 marks): B
- Q4 (MCQ, 2 marks): A
- Q5 (MCQ, 2 marks): D
- Q6 (MCQ, 2 marks): A
- Q7 (MCQ, 2 marks): C
- Q8 (MCQ, 2 marks): D
- Q9 (MCQ, 2 marks): D
- Q10 (MCQ, 2 marks): B
- Q11 (MCQ, 2 marks): A
- Q12 (MCQ, 2 marks): A
- Q13 (MCQ, 2 marks): B
- Q14 (MCQ, 2 marks): C
- Q15 (MCQ, 2 marks): A
- Q16 (MCQ, 2 marks): D
- Q17 (MCQ, 2 marks): A
- Q18 (MCQ, 2 marks): B
- Q19 (MCQ, 2 marks): D
- Q20 (MSQ, 2 marks): A, C, D
- Q21 (MSQ, 2 marks): A, C, D
- Q22 (MSQ, 2 marks): A, C
- Q23 (MCQ, 3 marks): A
- Q24 (MCQ, 3 marks): A
- Q25 (MCQ, 3 marks): B
- Q26 (MCQ, 3 marks): C
- Q27 (MCQ, 3 marks): D
- Q28 (MCQ, 3 marks): C
- Q29 (MCQ, 3 marks): D
- Q30 (MCQ, 3 marks): C
- Q31 (SA, 3 marks): -0.05 to 0.05
- Q32 (SA, 3 marks): 4
- Q33 (SA, 3 marks): 0
- Q34 (MCQ, 3 marks): C
- Q35 (MCQ, 2 marks): A
- Q36 (SA, 2 marks): 8
- Q37 (MCQ, 3 marks): D
- Q38 (MCQ, 3 marks): D
- Q39 (MCQ, 3 marks): B
- Q40 (MSQ, 4 marks): A, B, D
- Q41 (MSQ, 5 marks): B, C
Concepts this paper tests
Auto-generated summary from the source site. Handy as a checklist; the lessons above explain each idea from scratch.
Here’s a structured summary of core topics, concepts, principles, and equations essential for the Diploma Level: Machine Learning Practice exam, along with Mermaid knowledge graphs to visualize relationships.
Core Topics & Concepts
1. Scikit-Learn Fundamentals
Key Concepts:
Datasets in
sklearn.datasets:Loaders vs. Fetchers:
- Both return a
Bunchobject (dictionary-like with keys likedata,target,feature_names). - Loaders: Load small standard datasets (e.g.,
load_iris(),load_wine()). - Fetchers: Download larger datasets (e.g.,
fetch_california_housing()).
- Both return a
Synthetic Datasets:
make_blobs(),make_classification(),make_regression().
Dataset Attributes:
data.shape(notdata.shape()),target,feature_names,DESCR.
Bunch Object:
- Dictionary-like object with keys:
data,target,target_names,feature_names,DESCR.
- Dictionary-like object with keys:
Example Code Snippets:
from sklearn.datasets import load_wine
data = load_wine()
print(data.data.shape)  # Correct (no parentheses)
2. Data Preprocessing
Key Concepts:
Scaling:
StandardScaler: Standardizes features (mean=0, std=1).
scaler.fit(X)computes mean/std.scaler.transform(X)applies scaling.scaler.mean_gives the mean of features.
- MaxAbsScaler: Scales by maximum absolute value (each feature divided by its max abs value).
- MinMaxScaler: Scales to a range (e.g., [0, 1]).
Polynomial Features:
PolynomialFeatures(degree=2, interaction_only=True)generates:- Original features + interaction terms (no squared terms if
interaction_only=True). - Example:
[x1, x2] → [1, x1, x2, x1*x2].
- Original features + interaction terms (no squared terms if
Dummy Features:
add_dummy_feature(X)adds a column of 1s (bias term) at the start.
Encoding:
MultiLabelBinarizer: Converts multi-label data to binary matrix.
- Example:
[(1,2), (3,)] → [[1,1,0], [0,0,1]].
- Example:
Equations:
- StandardScaler:
where = mean, = standard deviation.
- MaxAbsScaler:
3. Model Training & Evaluation
Key Concepts:
Linear Models:
- LinearRegression: Fits .
- LogisticRegression: Binary/multi-class classification (uses
logisticorsoftmaxfor output). - SGDRegressor: Supports
shuffle=Trueto shuffle data every epoch.
Cross-Validation:
- LeaveOneOut (LOO): Uses samples for training, 1 for testing (repeated times).
- Train-Test Split:
train_test_split(X, y, test_size=0.2, random_state=42).
Metrics:
- Confusion Matrix: TP, TN, FP, FN.
- Recall (Sensitivity):
- Precision:
- R² Score:
Explained Variance (PCA):
pca.explained_variance_ratio_gives the proportion of variance explained by each component.
ROC Curve:
- Plots TPR (Recall) vs. FPR (1 - Specificity).
- Perfect classifier: Step at (0,1).
Example Code:
from sklearn.metrics import confusion_matrix
y_true = [0, 1, 2, 2, 2]
y_pred = [0, 0, 2, 2, 1]
cm = confusion_matrix(y_true, y_pred, labels=[0, 1, 2])
### Recall for class 2 = TP/(TP+FN) = 2/(2+1) = 0.67
4. Dimensionality Reduction
Key Concepts:
PCA (Principal Component Analysis):
- Transforms data to orthogonal components maximizing variance.
PCA(n_components=2).fit(X)computes components.explained_variance_ratio_gives variance explained by each component.
Equation:
where = eigenvectors of covariance matrix.
5. Clustering
Key Concepts:
K-Means:
KMeans(n_clusters=3).fit(X)assigns clusters.- Elbow Method: Plot
inertia_(WCSS) vs. number of clusters to find optimal . - Dendrogram: Hierarchical clustering visualization (uses
scipy.cluster.hierarchy).
6. Neural Networks
Key Concepts:
MLPClassifier/MLPRegressor:
hidden_layer_sizes=(10,5): 2 hidden layers (10 and 5 neurons).n_layers_: Total layers (input + hidden + output).coefs_: List of weight matrices (shape[n_layers-1]).Activation Functions:
- Output layer:
logistic(binary) orsoftmax(multi-class). - Hidden layers:
relu,tanh, etc.
- Output layer:
Example:
from sklearn.neural_network import MLPClassifier
mlp = MLPClassifier(hidden_layer_sizes=(8,12), random_state=12)
mlp.fit(X, y)
print(mlp.n_layers_)  # 4 (input + 2 hidden + output)
7. Ensemble Methods
Key Concepts:
VotingClassifier:
voting='hard': Majority vote.voting='soft': Predicts class with highest average probability.flatten_transform=True: Flattens output fortransform.
BaggingClassifier:
- Uses base estimators (e.g.,
SVC) with bootstrapping.
- Uses base estimators (e.g.,
8. Model Persistence & API Design
Key Concepts:
Scikit-Learn API Design Principles:
- Consistency: Uniform interface (e.g.,
fit,predict,transform). - Sensible Defaults: Works out-of-the-box (e.g.,
random_statefor reproducibility). - Inspection: Attributes like
coef_,feature_importances_. - Non-Proliferation of Classes: Avoids unnecessary class hierarchies.
- Consistency: Uniform interface (e.g.,
Key Equations Summary
| Concept | Equation |
|---|---|
| StandardScaler | |
| MaxAbsScaler | |
| R² Score | |
| Recall | |
| Precision | |
| PCA Transformation | (where = eigenvectors) |
| Polynomial Features (deg=2) | (if interaction_only=False) |
Exam Tips
Code Outputs: Focus on:
- Shape of transformed data (e.g.,
PolynomialFeatures). - Scaler outputs (e.g.,
StandardScaler.mean_). - Model attributes (e.g.,
coef_,n_features_in_).
- Shape of transformed data (e.g.,
Equations: Memorize:
- Scaling formulas (StandardScaler, MaxAbsScaler).
- Metrics (R², Recall, Precision).
- PCA variance explained.
- API Design: Know scikit-learn’s consistency (e.g.,
fit/predictpattern).
Visualizations:
- Elbow Method (K-Means).
- Dendrogram (Hierarchical Clustering).
- ROC Curve (Classification Performance).