Home / Past papers / MLP End Term / this paper
IIT M DIPLOMA FN EXAM QDD2 13 Apr 2025 - 13 Apr 2025
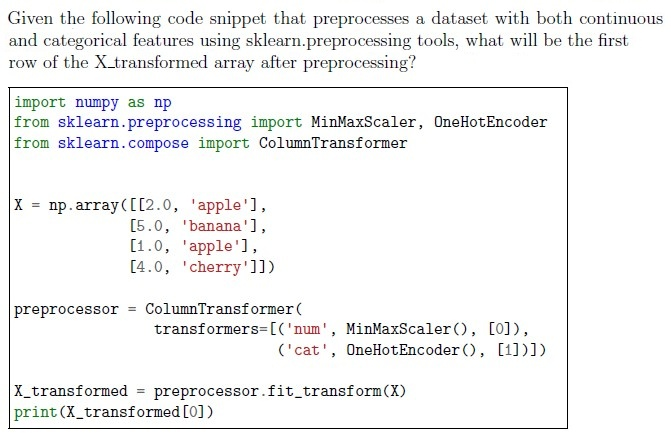


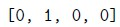
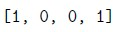
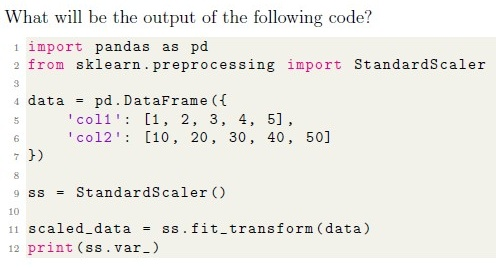


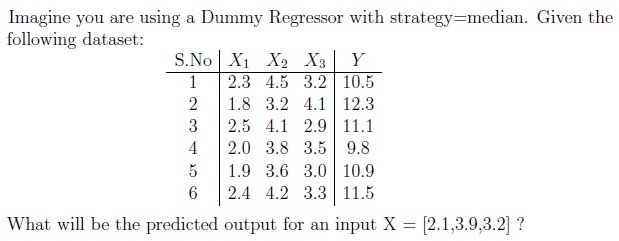
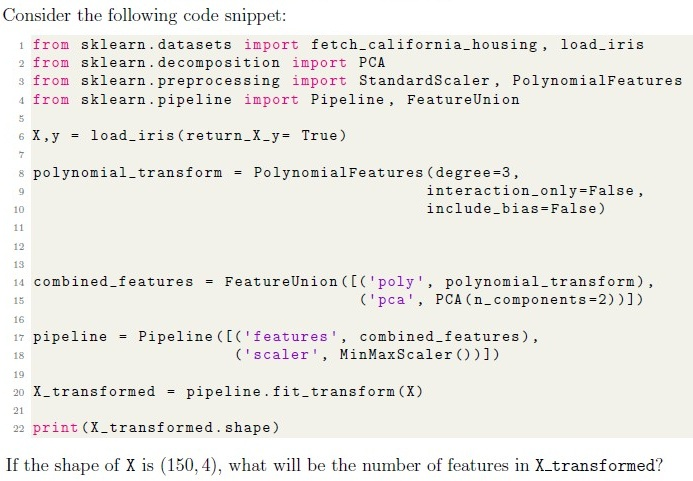
- 10.5
- 11.0
- 11.5
- 12.3
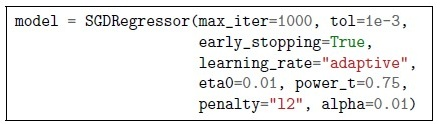
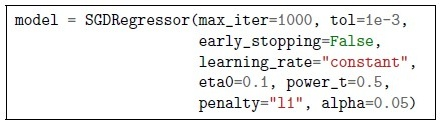
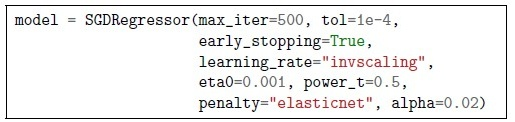
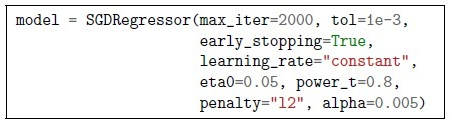
- Training the model.
- Choosing the best k value.
- Storing and searching through all training samples at prediction time.
- Calculating class probabilities.
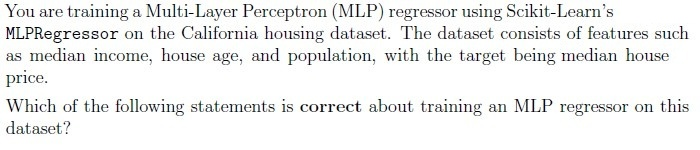
- Increasing the number of hidden layers always improves regression accuracy.
- Using the ReLU activation function in hidden layers is a good choice for MLPregression.
- The output layer should use a softmax activation to predict continuous houseprices.
- MLPRegressor does not require feature scaling since neural networksautomatically normalize input data.




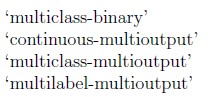
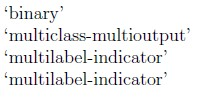
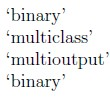





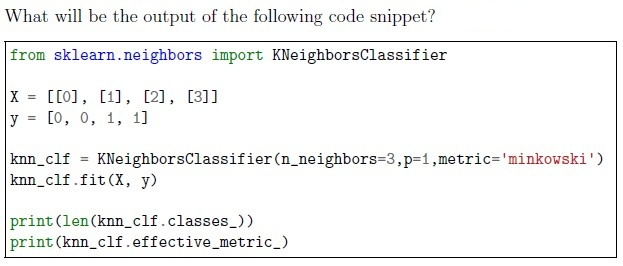
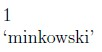
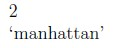
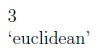
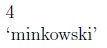
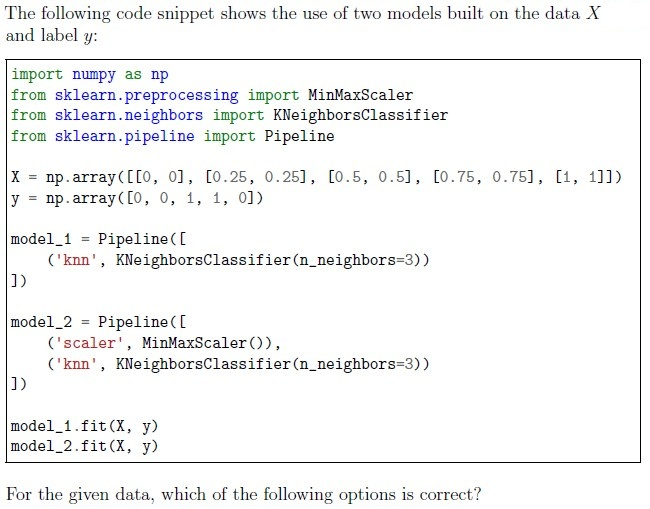










- It can only be used with classifiers that output probabilities.
- When voting=‘hard’, it chooses the class with the highest sum of predictedprobabilities.
- When voting=‘soft’, it averages the predicted probabilities and picks the classwith the highest probability.
- It cannot be used with Pipeline objects.

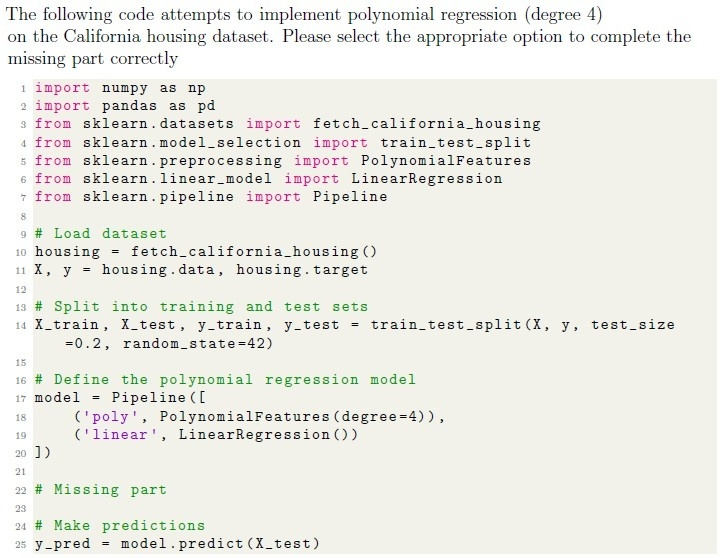
- Convert images to grayscale.
- Scaling the data using Min-Max Scaling
- Apply PCA to reduce feature dimensions.
- One-Hot encode the target labels (digits 0-9)
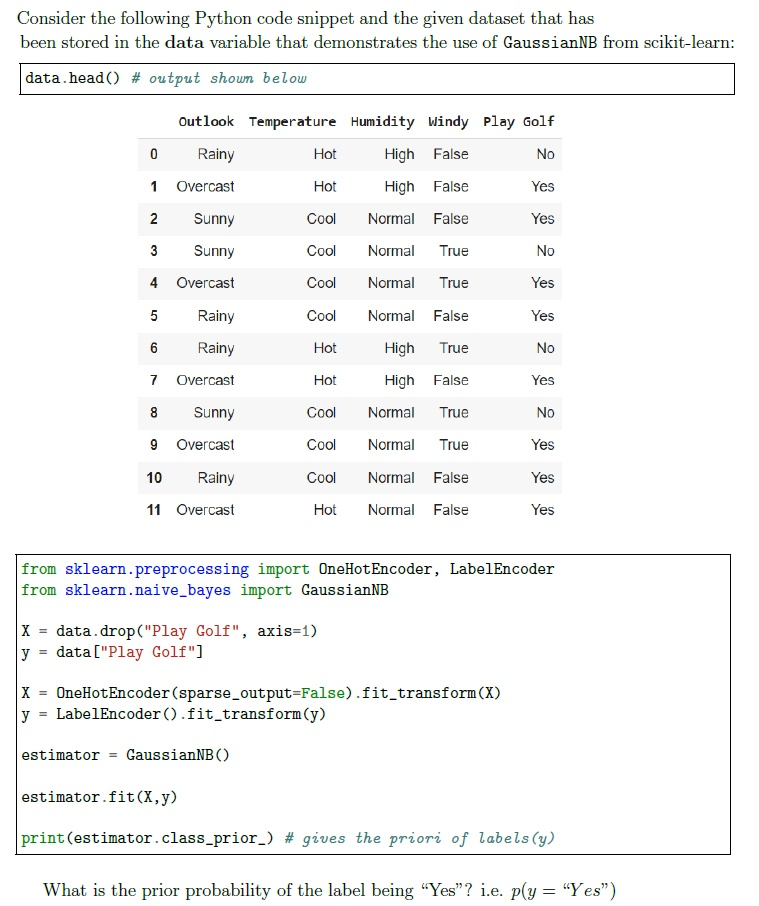

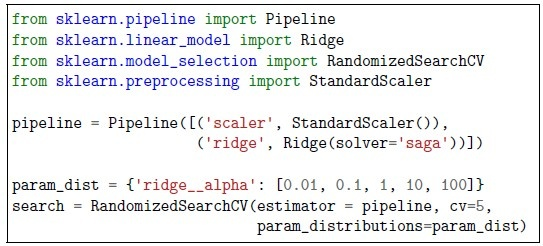
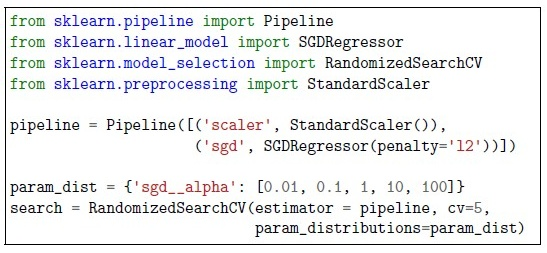
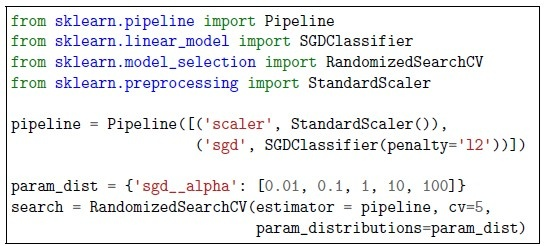
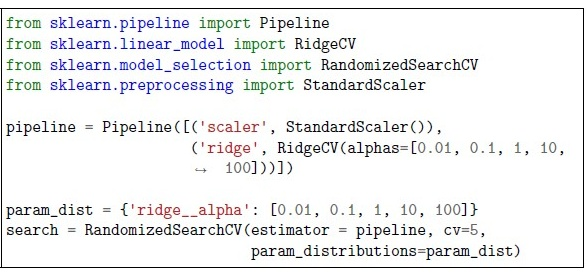




- GridSearchCV
- ElasticNetCV
- RandomizedSearchCV
- Mini batch gradient descent





- Euclidean Distance
- Manhattan Distance
- Jaccard Similarity
- Cosine Distance
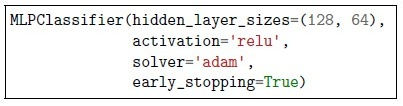
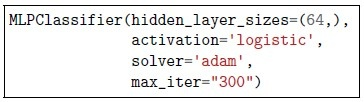
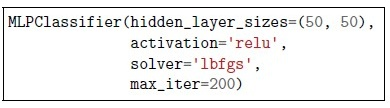
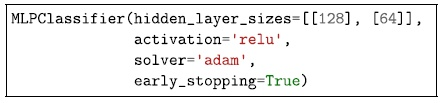




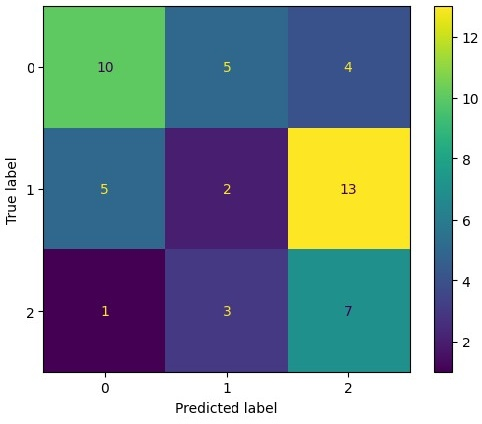 Use the confusion matrix given below. What is the recall score for the label (class) 1 ?

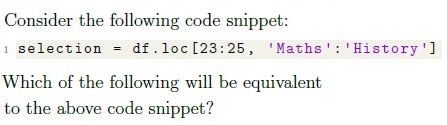




- Both the assertion and reason are correct, and the reason is a correctexplanation of the assertion
- Both the assertion and reason are correct, but the reason is not a correctexplanation of the assertion.
- The assertion is correct, but the reason is incorrect.
- The assertion is incorrect, but the reason is correct.
Answer key
- Q1 (MCQ, 1 marks): A
- Q2 (MCQ, 1 marks): D
- Q3 (MCQ, 1 marks): B
- Q4 (MCQ, 1 marks): A
- Q5 (MCQ, 1 marks): C
- Q6 (MCQ, 1 marks): B
- Q7 (MCQ, 2 marks): A
- Q8 (MCQ, 2 marks): C
- Q9 (MCQ, 2 marks): D
- Q10 (MCQ, 2 marks): B
- Q11 (MCQ, 2 marks): C
- Q12 (MCQ, 2 marks): D
- Q13 (MCQ, 2 marks): C
- Q14 (MCQ, 2 marks): B
- Q15 (SA, 3 marks): 0.659 to 0.680
- Q16 (MCQ, 3 marks): B
- Q17 (MSQ, 2 marks): A, C
- Q18 (MSQ, 2 marks): A, C
- Q19 (MSQ, 2 marks): A, B, C
- Q20 (MSQ, 2 marks): A, B, D
- Q21 (MSQ, 2 marks): A, C
- Q22 (MSQ, 3 marks): B, C
- Q23 (SA, 1 marks): 36
- Q24 (SA, 2 marks): 0.10
- Q25 (MSQ, 1 marks): A, C
- Q26 (SA, 1 marks): 120
- Q27 (SA, 1 marks): -1
- Q28 (MCQ, 1 marks): D
- Q29 (SA, 1 marks): 105
- Q30 (SA, 1 marks): 0.98
Concepts this paper tests
Auto-generated summary from the source site. Handy as a checklist; the lessons above explain each idea from scratch.
Here’s a structured summary of core topics, concepts, principles, and equations essential for the exam, followed by Mermaid knowledge graphs to visualize relationships.
Core Topics & Concepts
1. Data Preprocessing
Key Concepts:
Scaling/Normalization:
MinMaxScaler: Scales features to[0, 1]range. Formula:
StandardScaler: Standardizes features to mean=0, std=1. Formula:
- When to use: Distance-based algorithms (KNN, SVM, K-Means) require scaling.
Encoding Categorical Data:
OneHotEncoder: Converts categorical features into binary columns.LabelEncoder: Converts categorical labels into integers (e.g.,['Yes', 'No'] → [1, 0]).
Polynomial Features:
PolynomialFeatures(degree=n): Generates interaction terms up to degreen. Example: For features[a, b], degree=2 generates[1, a, b, a², ab, b²].
Pipelines:
Pipeline([('scaler', StandardScaler()), ('model', SGDRegressor())]): Chains preprocessing and modeling steps.
Common Pitfalls:
- Data Leakage: Fit preprocessing (e.g., scaling) only on training data, then transform test data.
- Sparse Data: Use
sparse=TrueinOneHotEncoderfor memory efficiency.
2. Supervised Learning Algorithms
A. Linear Models
Linear Regression:
- Hypothesis: .
- Loss Function (MSE):
Ridge (L2) vs. Lasso (L1) Regression:
- Ridge: Penalizes large coefficients (prevents overfitting).
- Lasso: Can shrink coefficients to zero (feature selection).
SGDRegressor:
- Optimizes loss using stochastic gradient descent.
Key parameters:
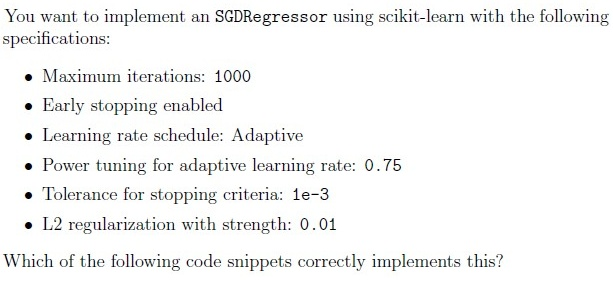
learning_rate='adaptive'(adjusts learning rate dynamically).penalty='l2'(Ridge),alpha=0.01(regularization strength).
B. Logistic Regression
- Sigmoid Function:
- Loss Function (Log Loss):
- Multiclass: Use
multi_class='multinomial'withsolver='lbfgs'.
C. k-Nearest Neighbors (KNN)
Distance Metrics:
- Euclidean:
- Manhattan:
- Bottleneck: Prediction time scales with training data size (use KD-Trees/Ball Trees for efficiency).
Hyperparameters:
n_neighbors: Trade-off between bias (smallk) and variance (largek).weights='distance': Closer neighbors have more influence.
D. Support Vector Machines (SVM)
Kernel Trick: Maps data to higher dimensions for linear separation.
- Linear:
- RBF:
- Regularization:
Ccontrols margin width (smallC→ wider margin, more regularization). SVC vs. SVR:
SVC: Classification (hinge loss).SVR: Regression (ε-insensitive loss).
E. Decision Trees & Ensembles
Decision Tree:
- Splits based on Gini impurity or entropy:
Overfitting Risk: Prune with
max_depthormin_samples_split.- Random Forest:
- Ensemble of trees trained on bootstrapped samples (
bootstrap=True). - Feature Randomness:
max_features='sqrt'(classification) or'auto'(regression). OOB Score: Out-of-bag error estimate (
oob_score=True).- AdaBoost:
- Sequentially trains weak learners (e.g., decision stumps), weighting misclassified samples higher.
Hyperparameters:
n_estimators: Number of weak learners.learning_rate: Shrinks contribution of each learner (default=1.0).
- Overfitting Mitigation: Reduce
n_estimatorsorlearning_rate.
F. Neural Networks (MLP)
Architecture:
- Input layer → Hidden layers (ReLU/tanh) → Output layer (softmax for classification, linear for regression).
Key Parameters:
hidden_layer_sizes=(100,): Single hidden layer with 100 neurons.activation='relu': Fast convergence, avoids vanishing gradients.solver='adam': Adaptive learning rate.early_stopping=True: Stops training if validation score doesn’t improve.
- Scaling: Critical for MLP (use
StandardScaler).
3. Model Evaluation
Metrics:
| Metric | Formula | Use Case |
|---|---|---|
| Accuracy | Balanced datasets. | |
| Precision | Minimize false positives. | |
| Recall (Sensitivity) | Minimize false negatives. | |
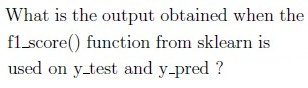
| F1-Score | Imbalanced datasets. | |
| ROC-AUC | Area under ROC curve (TPR vs. FPR). | Binary classification. |
| MSE/RMSE | Regression. |
Confusion Matrix:
              Predicted
            |   0   |   1   |
-----------|-------|-------|
Actual 0   |  TN   |  FP   |
Actual 1 | FN | TP |- Recall for Class 1: .
Imbalanced Data:
- Problem: Accuracy is misleading if classes are imbalanced.
Solutions:
- Use F1-score, precision-recall curve, or ROC-AUC.
- Resample data (oversample minority class or undersample majority class).
- Class weights (
class_weight='balanced').
4. Unsupervised Learning
A. Clustering
K-Means:
- Objective: Minimize within-cluster variance (inertia).
Hyperparameters:
n_clusters: Number of clusters (use elbow method).init='k-means++': Better initialization than random.
Scaling: Required (uses Euclidean distance).
- Hierarchical Clustering:
Linkage Methods:
- Single: Minimum distance between clusters.
- Complete: Maximum distance.
- Average: Mean distance.
- Ward: Minimizes variance.
- Distance Metrics: Euclidean, Manhattan, Cosine.
B. Dimensionality Reduction
PCA (Principal Component Analysis):
- Transforms data to orthogonal axes (principal components) maximizing variance.
- Variance Explained: Choose
n_componentsto retain ≥95% variance. - Scaling: Required (PCA is distance-based).
- FeatureUnion: Combines multiple feature transformations (e.g., PCA + polynomial features).
5. Hyperparameter Tuning
Methods:
- GridSearchCV: Exhaustive search over specified parameter values.
- RandomizedSearchCV: Samples random combinations (faster for large spaces).
Key Parameters:
cv=5: 5-fold cross-validation.n_iter=10: Number of random samples (forRandomizedSearchCV).
Example for Ridge Regression:
param_dist = {'ridge__alpha': [0.01, 0.1, 1, 10, 100]}
search = RandomizedSearchCV(pipeline, param_distributions=param_dist, cv=5)
6. Model Interpretation & Debugging
Common Issues:
Overfitting:
- Symptoms: High training accuracy, low test accuracy.
Solutions:
- Regularization (L1/L2).
- Prune trees (
max_depth). - Early stopping (neural networks).
- More data or features.
Underfitting:
- Symptoms: Low training/test accuracy.
Solutions:
- Increase model complexity (more layers/neurons).
- Add features/polynomial terms.
- Reduce regularization.
Debugging Tips:
- Learning Curves: Plot training vs. validation error vs. dataset size.
- Feature Importance: Use
model.feature_importances_(tree-based) or coefficients (linear models).
7. Scikit-Learn Specifics
Key Classes/Methods:
| Task | Class/Method | Example |
|---|---|---|
| Train-test split | train_test_split | X_train, X_test, y_train, y_test = train_test_split(X, y, test_size=0.2) |
| Cross-validation | cross_val_score | scores = cross_val_score(model, X, y, cv=5) |
| Dummy models | DummyClassifier(strategy='median') | Baseline comparison. |
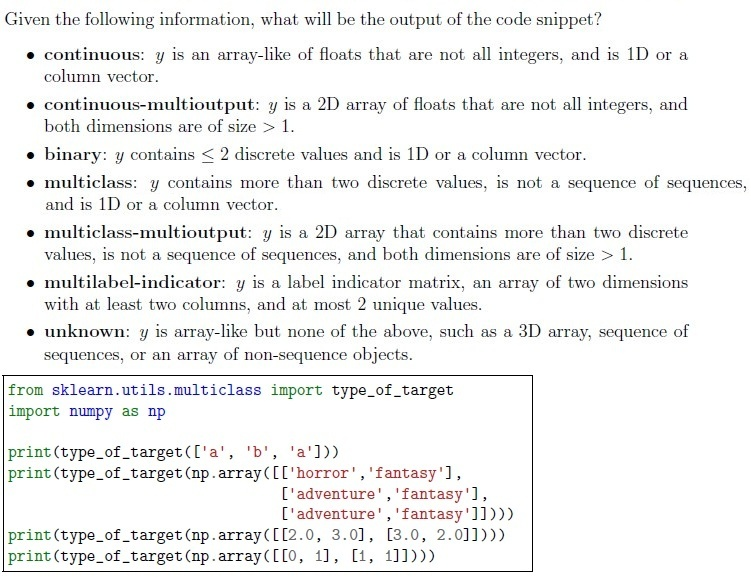
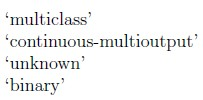
| Target type detection | type_of_target | type_of_target(y) → 'multiclass' |
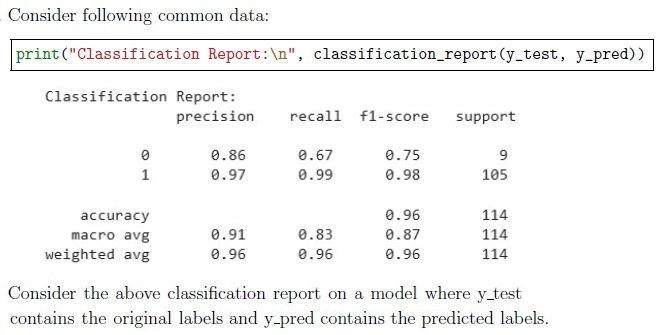
| Classification report | classification_report | print(classification_report(y_true, y_pred)) |
Pitfalls:
fitvs.transform:fit: Learns parameters (e.g., mean/std for scaling).transform: Applies learned parameters.- Always fit on training data only!
- Data Leakage: Avoid scaling/encoding before train-test split.