Home / Past papers / MLP Quiz 1 / this paper
IIT M DIPLOMA AN2 EXAM QDD2 25 Feb 2024 - 25 Feb 2024
Elapsed 00:00
Comprehension passage - the questions below it refer to this
Based on the above data, answer the given subquestions.
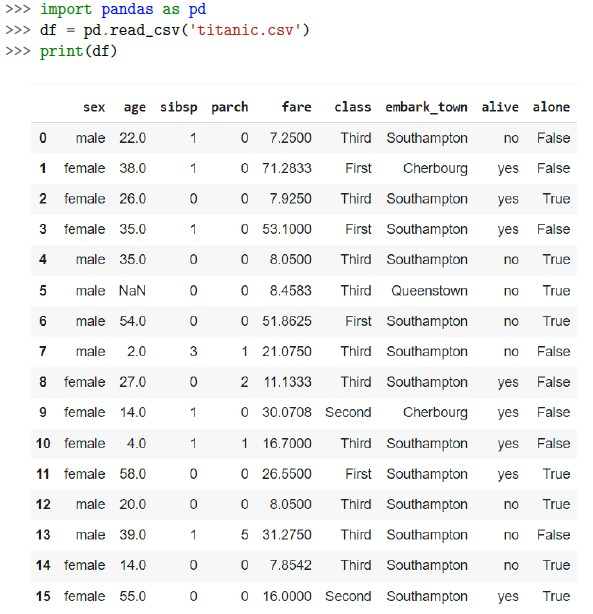
Choose the correct options to determine the count of NULL values in each column of a pandas DataFrame named ’df’




Which option will help in selecting data of odd indexed columns only? (ie. age, parch are odd indexed 1 and 3 respectively)




What is datatype of sex column in the given titanic dataset
- number
- bool
- str
- object
Which option will help in filtering data to find females who are alive after titanic incident?




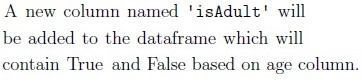
What is the given code below trying to accomplish for the given titanic dataset ?
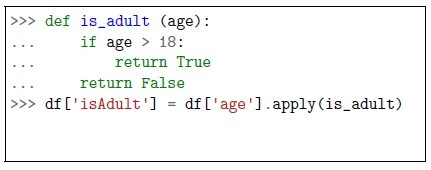 What is the given code below trying to accomplish for the given titanic dataset ?




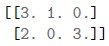
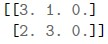
You are working on a machine learning project that aims to predict housing prices based on various features of the houses. As the first step, you decide to perform exploratory data analysis and visualize the data to understand its structure and relationships. Which of the following visualization techniques or principles is LEAST likely to provide meaningful insights for this kind of regression problem?
- Plotting a heatmap of the correlation matrix to understand the linearrelationship between the numeric features.
- Using a scatter plot to visualize the relationship between the square footage ofa house and its price.
- Visualizing the distribution of housing prices using a pie chart.
- Creating box plots for housing prices, grouped by the number of bedrooms, todetect outliers and understand the distribution across different categories.
A company collects 40000 samples (examples) to build a Machine Learning model for an application. They decide to use 30% of the total samples for testing (to be stored in the variable testset) and the rest 70% for training (to be stored in the variable trainset). They also want to sample the same set of samples across multiple runs. Which of the following line (statement) achieves this task? Assume that all samples are stored in the variable data.




Choose the option based on the following statements: Statement 1: The train-test split allows us to simulate the model’s performance on new data by reserving a portion of the dataset for testing. Statement 2: Separating the dataset into training and testing sets helps prevent data leakage, where information from the test set unintentionally influences the model during training. This ensures a fair assessment of the model’s generalization capabilities.
- Statement 1 is True and statement 2 is False
- Statement 1 is False and statement 2 is True
- Both the statements are False
- Both the statements are True
In which of the following scenarios is data cleaning most required?
- Data has missing values and categorical string data.
- Data consists a lot of outliers based on values in target(y) column
- The data consists solely of numerical values and are on a similar scale.
- None of the choices
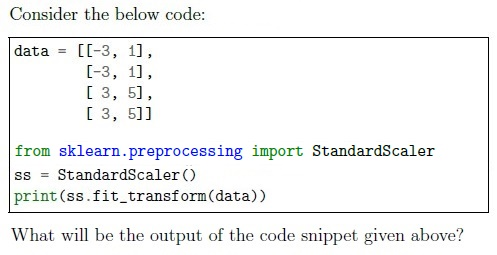

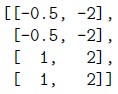

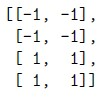
Which of the following metrics indicate higher their value, better the regression model’s performance?
- RMSE
- R2
- Mean absolute error
- Mean squared error
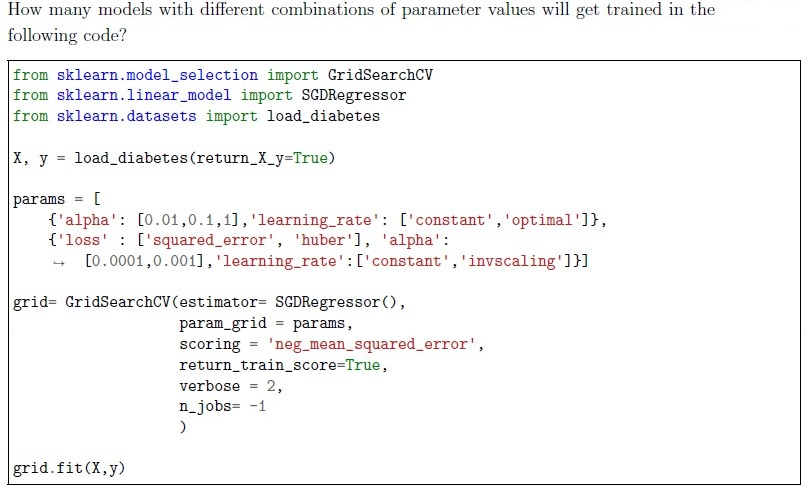
- 10
- 12
- 14
- 16
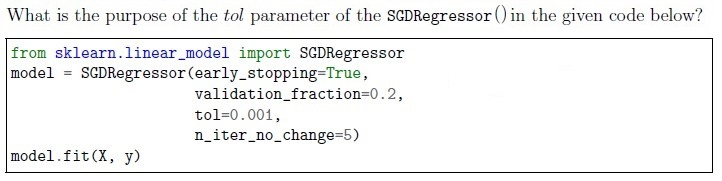
- It controls the learning rate of the stochastic regressor during training.
- It determines the maximum number of iterations for the training process.
- It defines the fraction of the validation set used for early stopping.
- It specifies the tolerance level for early stopping based on the change in thevalidation error.
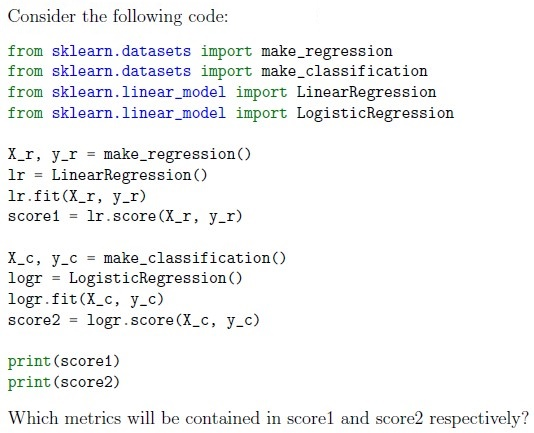
- Accuracy, Accuracy
- R2 score, R2 score
- Accuracy, R2 score
- R2 score, Accuracy
- F1 score, Precision
- Precision, Recall
- MAE, MSE
- The code will result in an error.
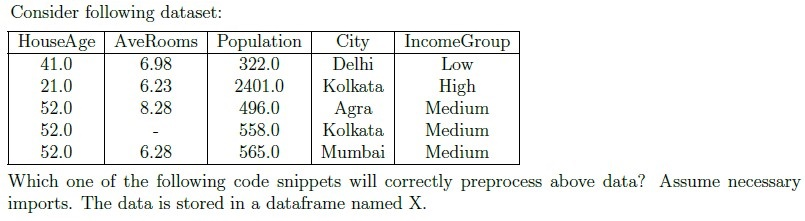
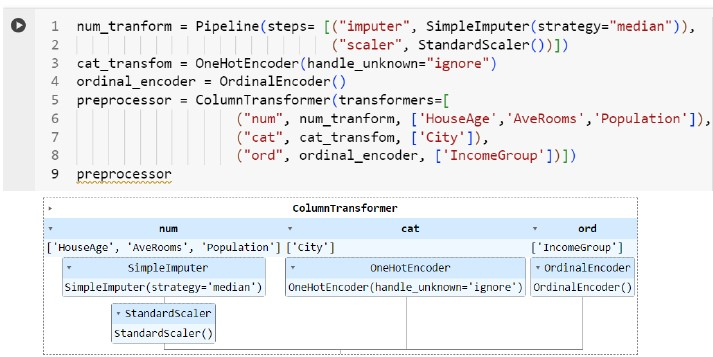
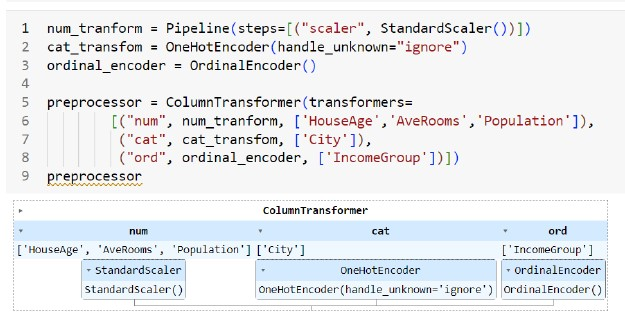
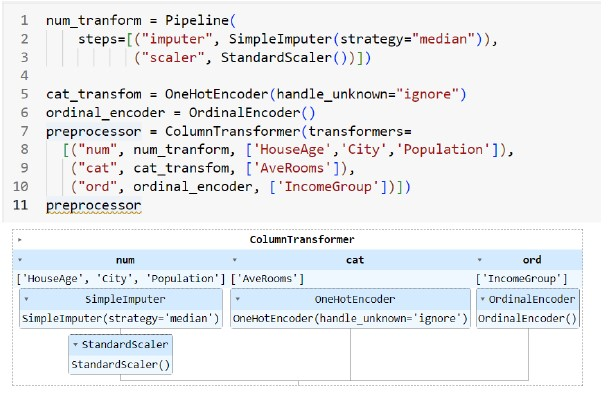
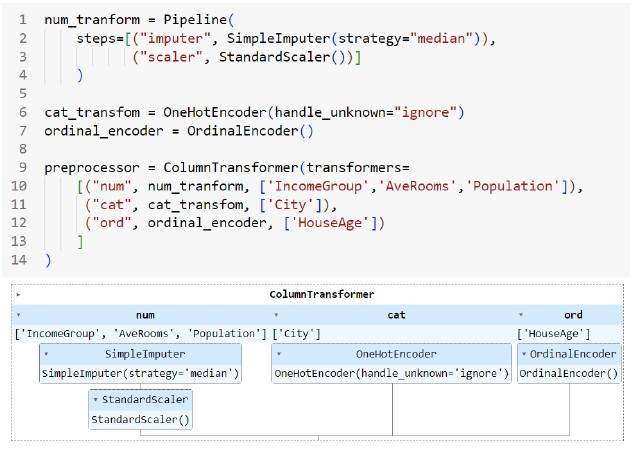
Suppose that we plot the histogram of numerical features in a data set. This reveals which of the following information?
- Scale of the features
- (left or right) Skew of the distribution
- Modes in the distribution
- Missing values
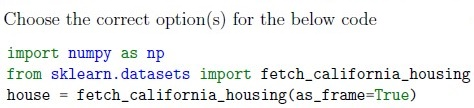
- house.data.shape will give the count of number of rows and columns forfeatures and labels(target) both
- house.target_names will give the name of the target column
- house.data.head() will show last 5 rows of the data
- house.feature_names will give a list of names of the columns of the featurematrix
Which of the following are valid loss functions for SGDClassifier?
- Squared Loss
- Hinge Loss
- Log Loss
- Mean Absolute Error
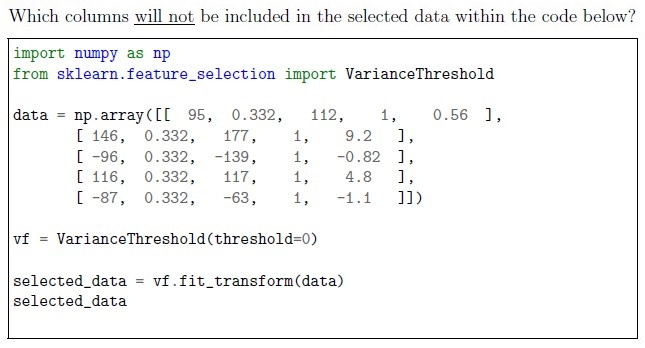
- Column indexed at 0
- Column indexed at 1
- Column indexed at 2
- Column indexed at 3
- Column indexed at 4
- No columns
Which of the following Evaluation metrics can be used in a regression problem?
- Mean Squared Error
- Accuracy
- F1-Score
- Mean Absolute Error
- credit score
- CGPA
Which of the following feature(s) will be selected in X_selected from X ?
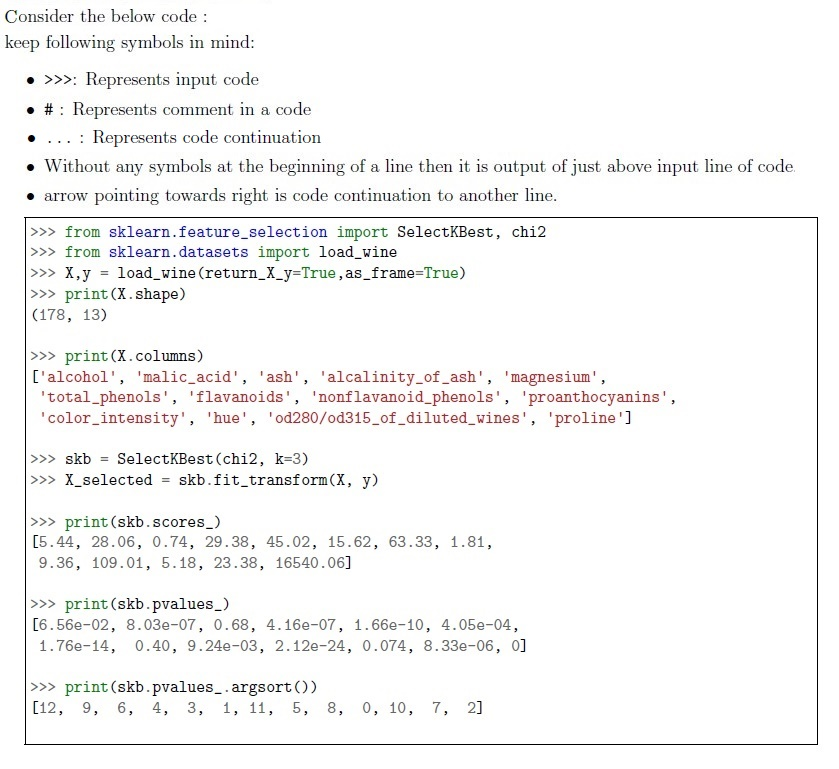
- malic_acid
- magnesium
- flavanoids
- proanthocyanins
- color_intensity
- proline




Answer key
- Q1 (MCQ, 2 marks): A
- Q2 (MCQ, 2 marks): B
- Q3 (MCQ, 2 marks): D
- Q4 (MCQ, 2 marks): A
- Q5 (MCQ, 2 marks): C
- Q6 (MCQ, 1 marks): C
- Q7 (MCQ, 2 marks): C
- Q8 (MCQ, 2 marks): C
- Q9 (MCQ, 2 marks): D
- Q10 (MCQ, 2 marks): A
- Q11 (MCQ, 2 marks): D
- Q12 (MCQ, 2 marks): B
- Q13 (MCQ, 2 marks): C
- Q14 (MCQ, 2 marks): D
- Q15 (MCQ, 2 marks): D
- Q16 (MCQ, 3 marks): A
- Q17 (MSQ, 2 marks): A, B, C
- Q18 (MSQ, 2 marks): B, D
- Q19 (MSQ, 2 marks): B, C
- Q20 (MSQ, 2 marks): B, D
- Q21 (MSQ, 2 marks): A, D
- Q22 (MSQ, 3 marks): C, E, F
- Q23 (MSQ, 3 marks): A, D
- Q24 (SA, 2 marks): 4
Concepts this paper tests
Auto-generated summary from the source site. Handy as a checklist; the lessons above explain each idea from scratch.
Summary of Core Topics, Concepts, Principles, and Equations
1. Pandas DataFrame Operations
- Handling NULL Values: Use
df.isnull().sum()to count NULL values in each column. - Selecting Odd Indexed Columns: Use
df.iloc[::, 1::2]to select odd indexed columns. - Data Types: Understanding data types in pandas, such as
objectfor strings. - Filtering Data: Use
df[(df['sex'] == 'female') & (df['alive'] == 'yes')]to filter data based on conditions.
2. Data Preprocessing
- Handling Missing Values: Use
SimpleImputerto fill missing values with mean, median, or other strategies. - Standard Scaling: Use
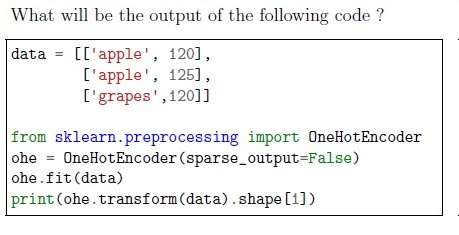
StandardScalerto scale data to have a mean of 0 and a standard deviation of 1. - One-Hot Encoding: Use
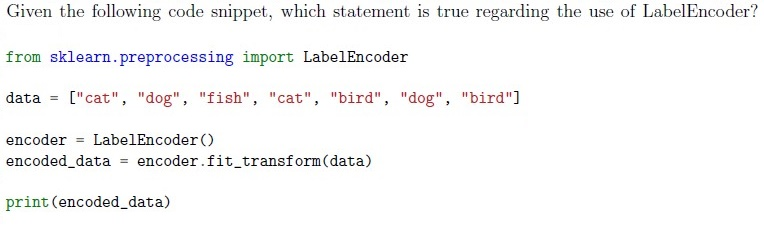
OneHotEncoderto convert categorical data into numerical format. - Label Encoding: Use
LabelEncoderto convert categorical data into numerical labels.
3. Machine Learning Models and Evaluation
- Linear Regression: Use
LinearRegressionfor regression problems. - Logistic Regression: Use
LogisticRegressionfor classification problems. - Evaluation Metrics: Use metrics like RMSE, R2 score, Mean Absolute Error for regression problems.
- Grid Search: Use
GridSearchCVfor hyperparameter tuning.
4. Data Visualization
- Heatmaps: Use heatmaps to understand the linear relationship between numeric features.
- Scatter Plots: Use scatter plots to visualize the relationship between two variables.
- Box Plots: Use box plots to detect outliers and understand the distribution across different categories.
- Histograms: Use histograms to reveal the scale, skew, and modes of the distribution of numerical features.
5. Feature Selection
- Variance Threshold: Use
VarianceThresholdto remove features with low variance. - SelectKBest: Use
SelectKBestwith statistical tests like chi2 to select the best features.
6. Model Training and Evaluation
- Train-Test Split: Use
train_test_splitto split data into training and testing sets. - Early Stopping: Use
early_stoppingin models likeSGDRegressorto stop training if the validation score does not improve. - Loss Functions: Understand different loss functions like Hinge Loss and Log Loss for classification problems.
Equations
1. Standard Scaling
where is the scaled value, is the original value, is the mean, and is the standard deviation.
2. Mean Squared Error (MSE)
where is the actual value and is the predicted value.
3. R2 Score
where is the mean of the actual values.